
Client Resources
Market Data Bank
Click image to enlarge
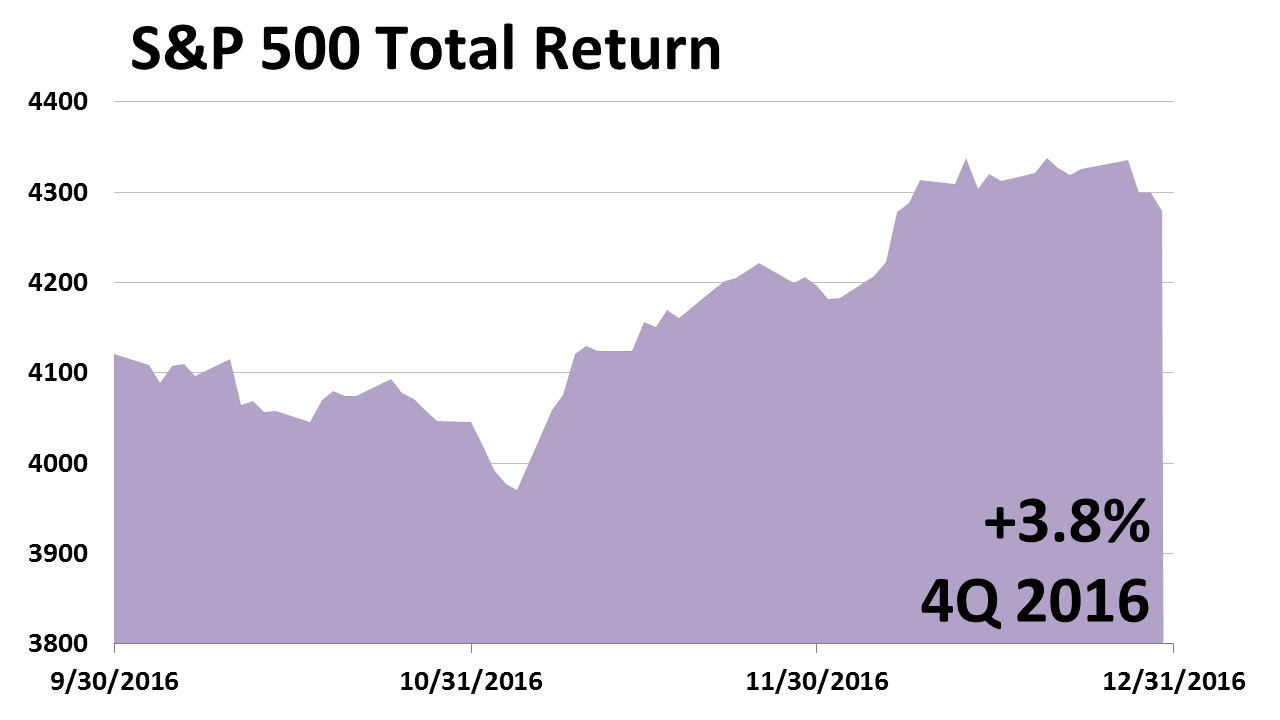
ECONOMY AND STOCKS STRONG
Large-U.S. company shares posted a 3.8% Q4 total return following 3.9% in Q3, 2.5% in Q2, and a 1.4% Q1 of 2016. A strong Q4 was attributed to the "Trump rally" and aided by an exceptional 3.5% rate of GDP growth in Q3, a strong earnings recovery in the S&P 500, and oil production cuts announced by OPEC.
Click image to enlarge
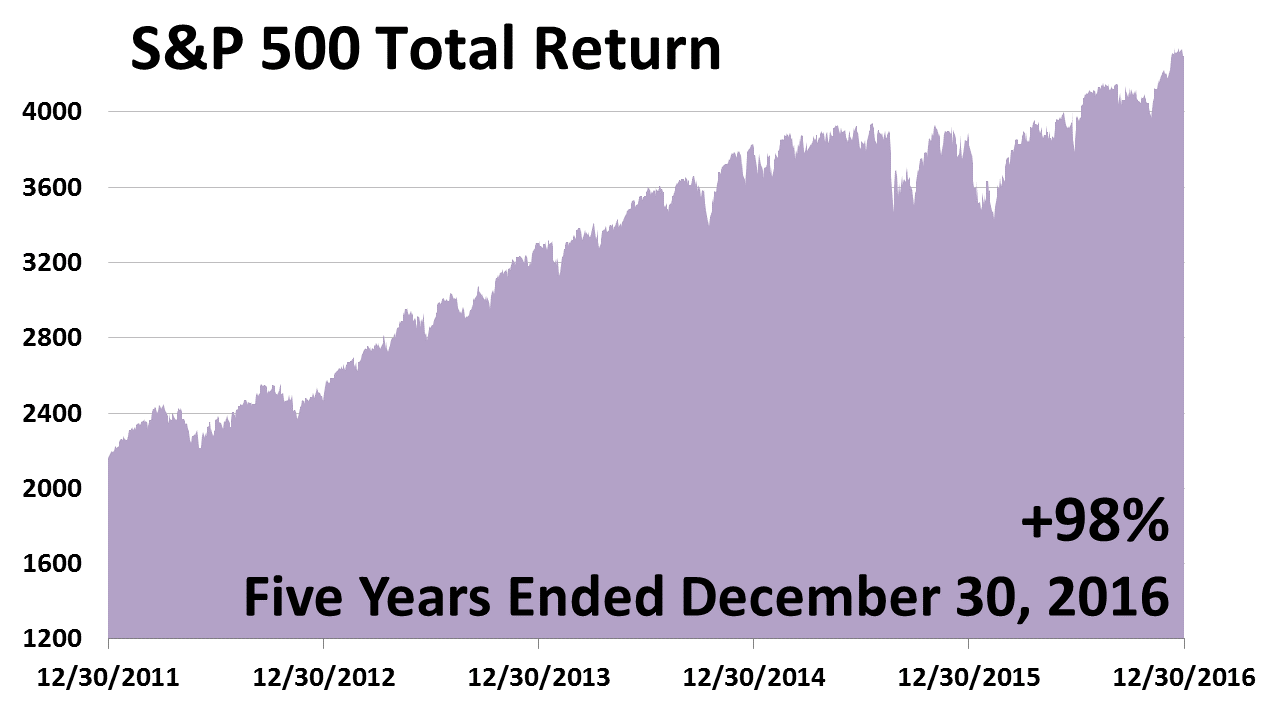
A GREAT FIVE YEARS
Over the five years ended December 30, 2016, the S&P 500 returned a total of 98%, in a great bull run. After trading sideways for about a year, from mid-2015 to mid-2016 - nosediving in two frightening double-digit descents - the S&P 500 broke out in the second half of 2016.
Click image to enlarge
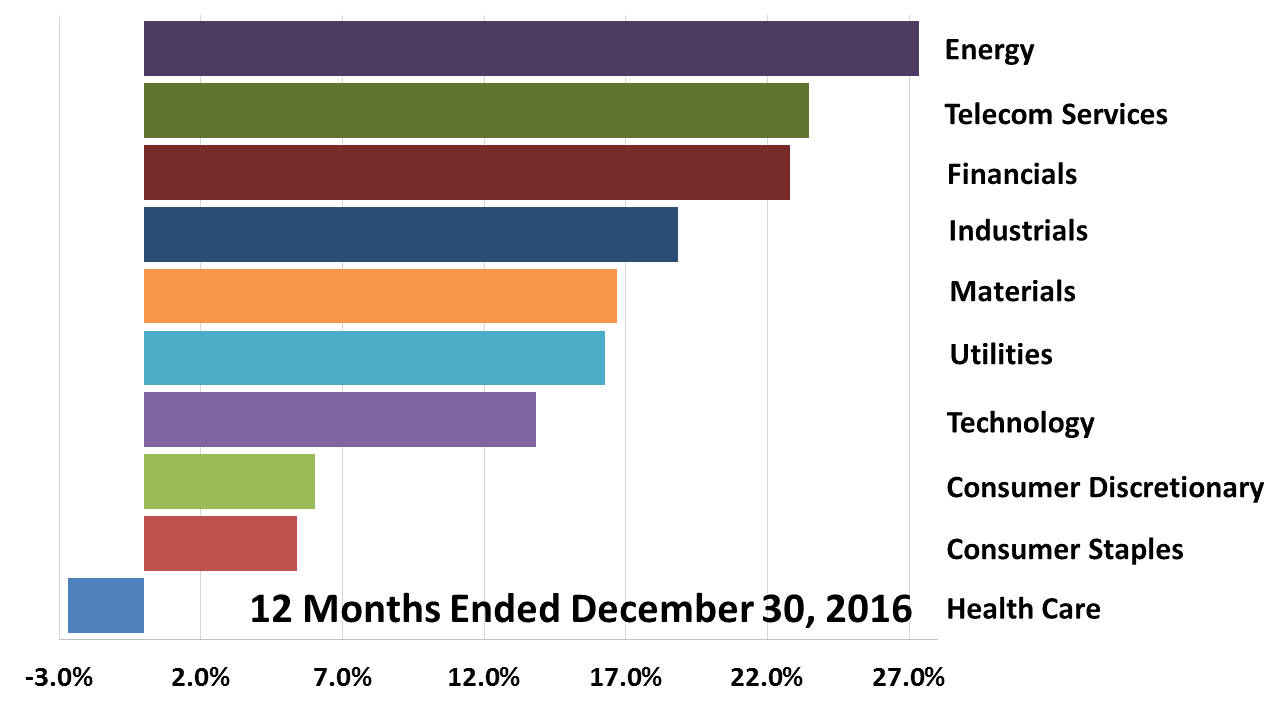
ENERGY TOPS ALL SECTORS
For the 12 months ended December 30, 2016, the energy sector was a standout among stock sectors, recovering from 2015's oil price collapse. Telecom, the No. 2 performing sector, showed a 23.5% gain as investors sought dividend yield in lieu of record-low bond yields.
Click image to enlarge
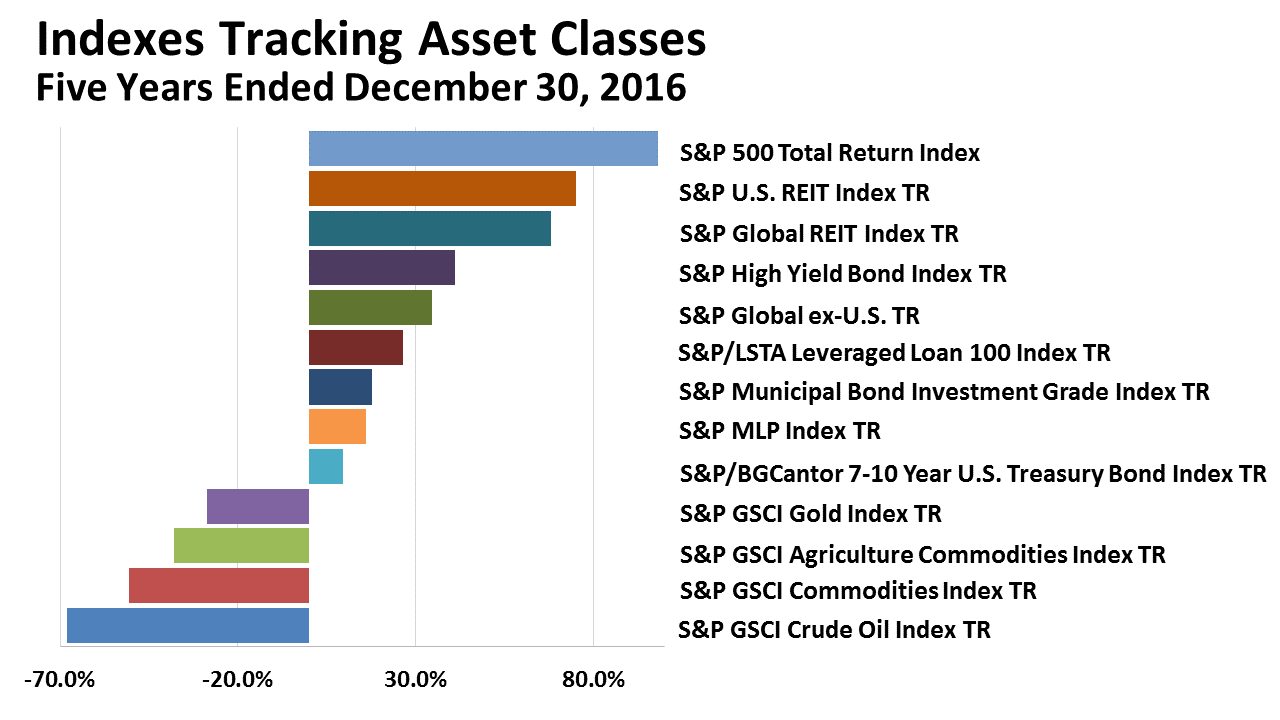
INDEXES TRACKING ASSET CLASSES
In the five years ended December 30, 2016, large-cap U.S. stocks were the No. 1 performer among these 13 asset classes. A prudent investor would, by definition, own an array of asset classes and lag the S&P 500. But a broadly diversified investor also would not have performed as poorly as the worst-performing asset class.

Click image to enlarge
THIS EXPANSION VERSUS OTHERS
This chart of recessions and recoveries since 1957 versus stock prices shows the current expansion, at 91-months old, is only about two years shy of becoming the longest recovery in modern U.S. history. If nothing bad happens, this expansion stands a fair chance of becoming the longest on record.
Click image to enlarge
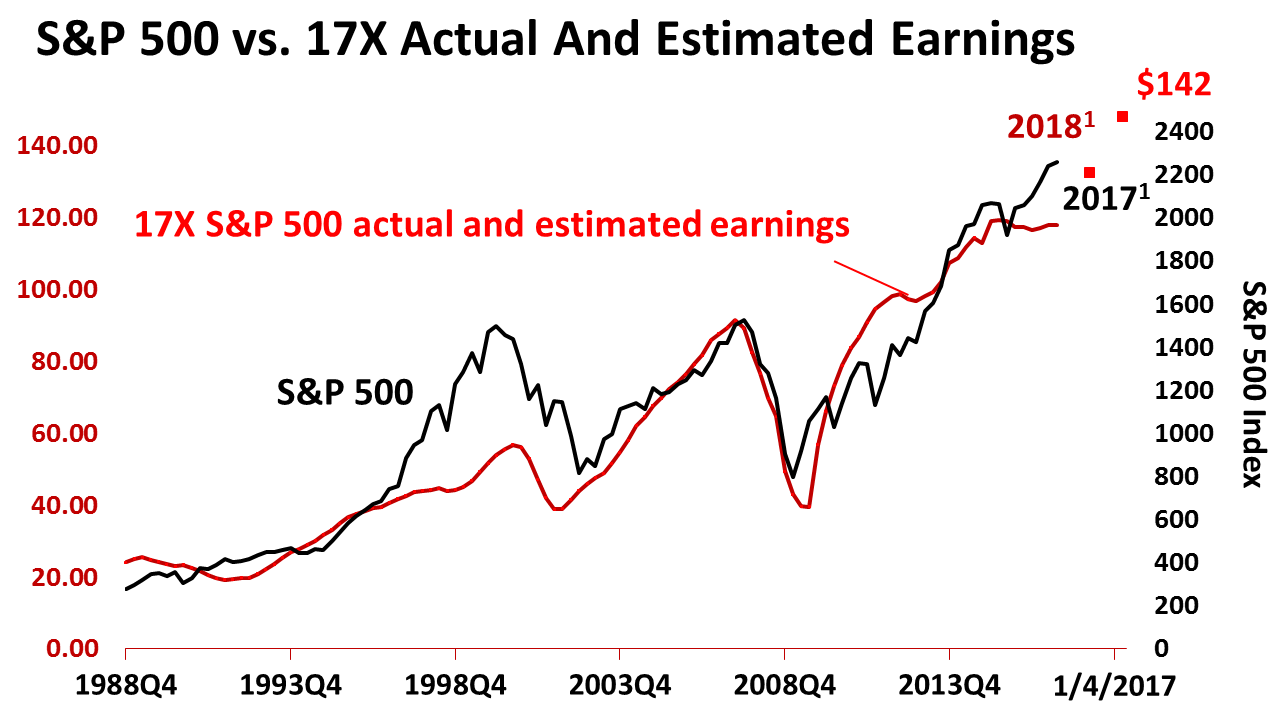
S&P 500 INDEX VS. EARNINGS¥
A Republican majority controls both chambers of the U.S. Congress and, under President-elect Donald J. Trump, a cut in corporate tax rates is expected to be enacted in 2017. As a result, strategists have begun raising earnings estimates on the 500 S&P companies, most recently to $142 per share.
Past performance of investments is not a very reliable indicator of future performance. Indices and ETFs representing asset classes are unmanaged and not recommendations for any specific investment. Foreign investing involves currency and political risk and foreign-country instability. Bonds offer a fixed rate of return while stocks fluctuate. Leading economic indicators from the Conference Board. S&P 500 earnings bottom-up operating earnings per share for 2015 (actual), 2016 (estimated) and 2017 (estimated) as of January 4, 2017: for 2017, $118.86; for 2018, $142. Sources: Yardeni Research, Inc. and Thomson Reuters I/B/E/S survey of consensus estimates. Standard and Poor's for index price data through January 4, 2017; and actual operating earnings data through 2016.

