
Client Resources
Market Data Bank
Click image to enlarge
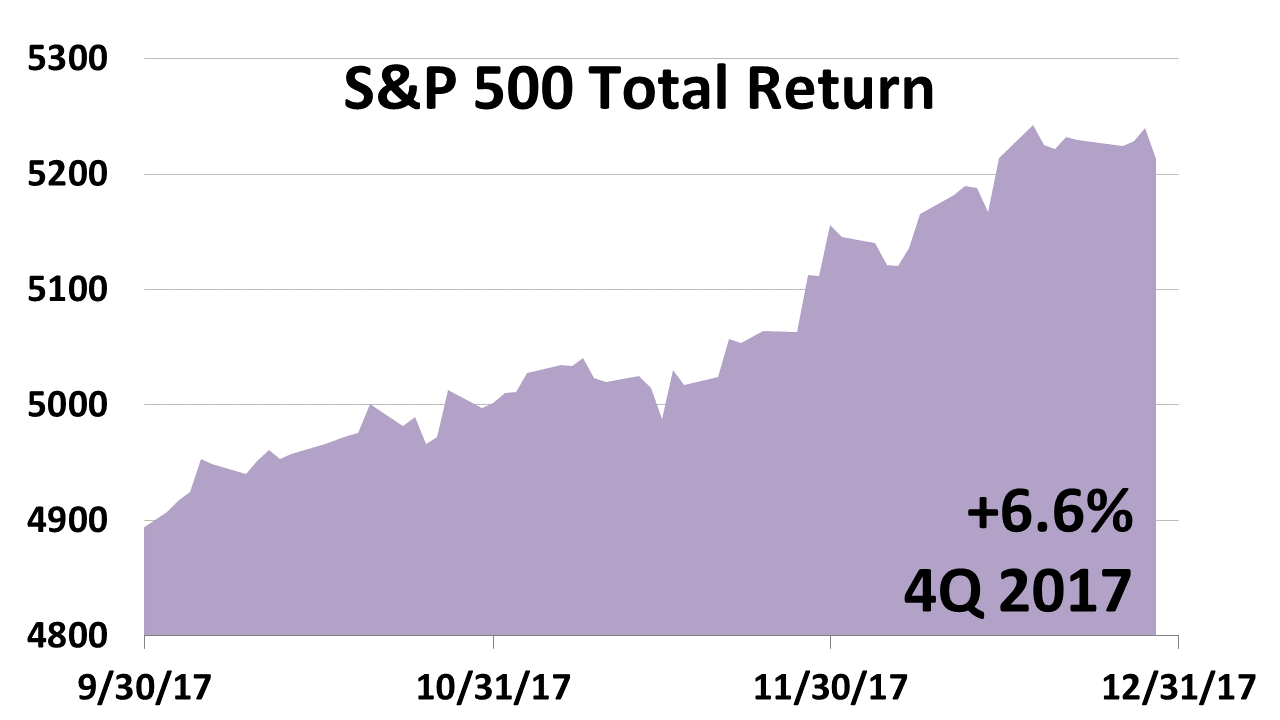
VERY STRONG ECONOMY AND STOCKS
Stocks returned 6.6% in the fourth quarter of 2017, following first-, second- and third-quarter returns of, respectively, 6.1%, 3.1% and 4.5%. In 2017, the total return on the S&P 500 was 21.8% — more than double the annual return of 10%, averaged since stock return records were first tracked more than 90 years ago.
Click image to enlarge
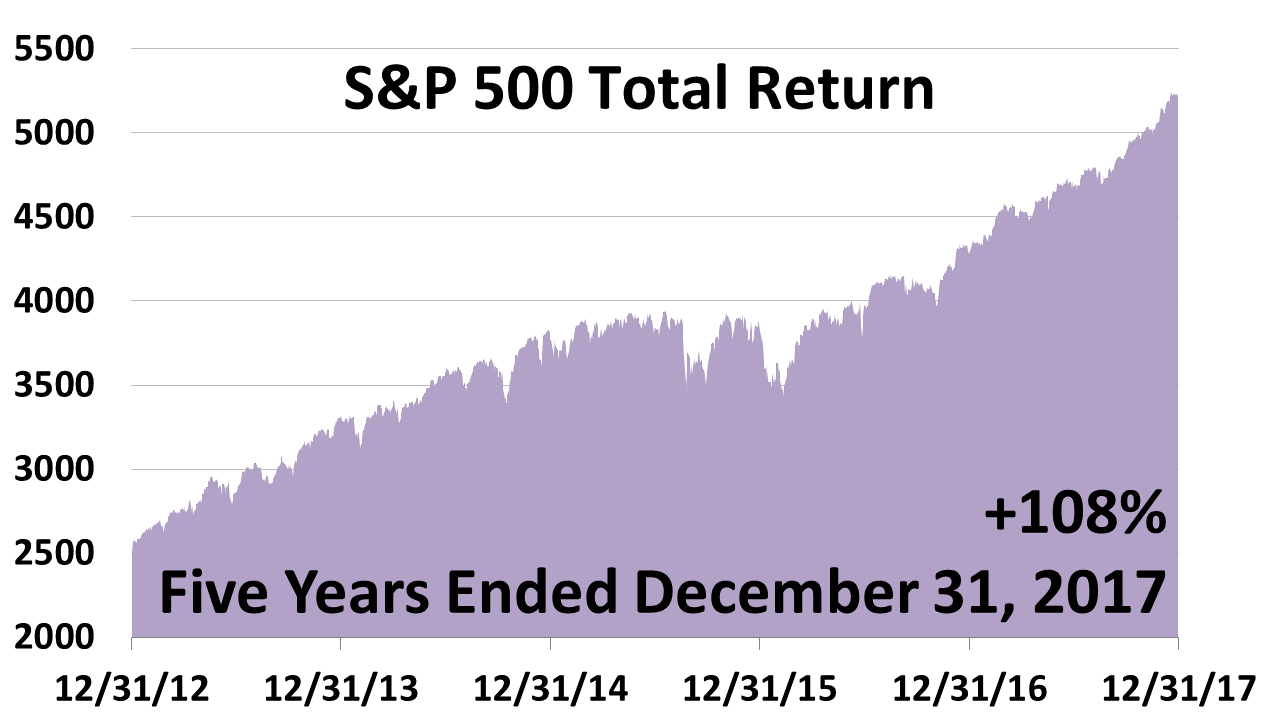
STOCKS DOUBLED IN FIVE YEARS
In the five-years through 2017, a dollar invested in the S&P 500 more than doubled. Since 1928, based on average returns, it took seven years for stocks to double in value. Doubling in five years is 40% better than averaged historically, making the U.S. by far the top-performer among the world’s major stock markets.
Click image to enlarge
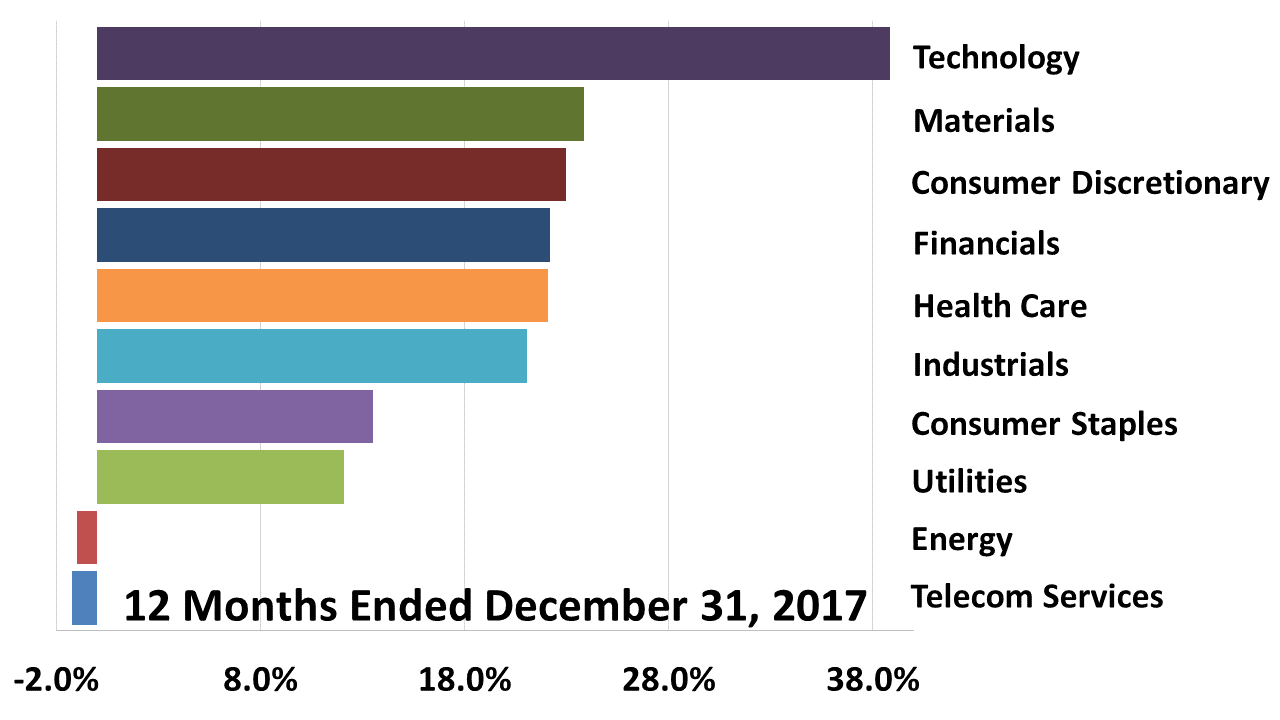
GROWTH SECTORS LED IN 2017
In the five-years through 2017, stocks characterized as good values lagged. Energy, telecom, utilities and consumer staples were out of favor with investors hungry for companies most appreciated for accelerating earnings and riding the tailwind of the expansion.
Click image to enlarge
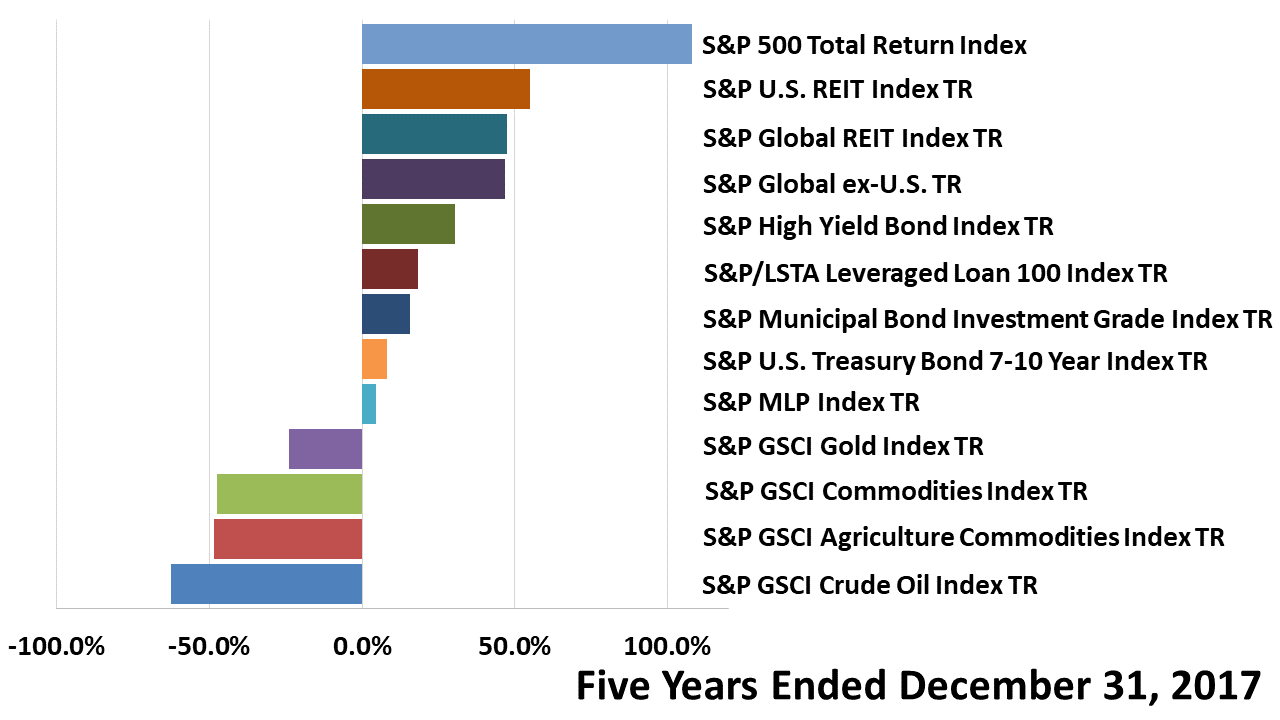
INDEXES TRACKING 13 ASSET CLASSES
In the 12 months ended December 31, 2017, foreign stocks came out on top of this broad array of 13 asset classes. For the first time since the U.S. expansion began in April 2009, foreign economies grew as fast the U.S. Stock markets everywhere surged as the synchronized global expansion kicked in.

Click image to enlarge
APPROACHING THE LONGEST BOOM
At 103-months old, this is the third-longest expansion in modern U.S. history. We soon will surpass the 106-month long expansion of the 1960s and are just 18 months from the 120-month boom of the 1990s — the longest ever. This growth cycle seems quite capable of setting a new modern record.
Click image to enlarge
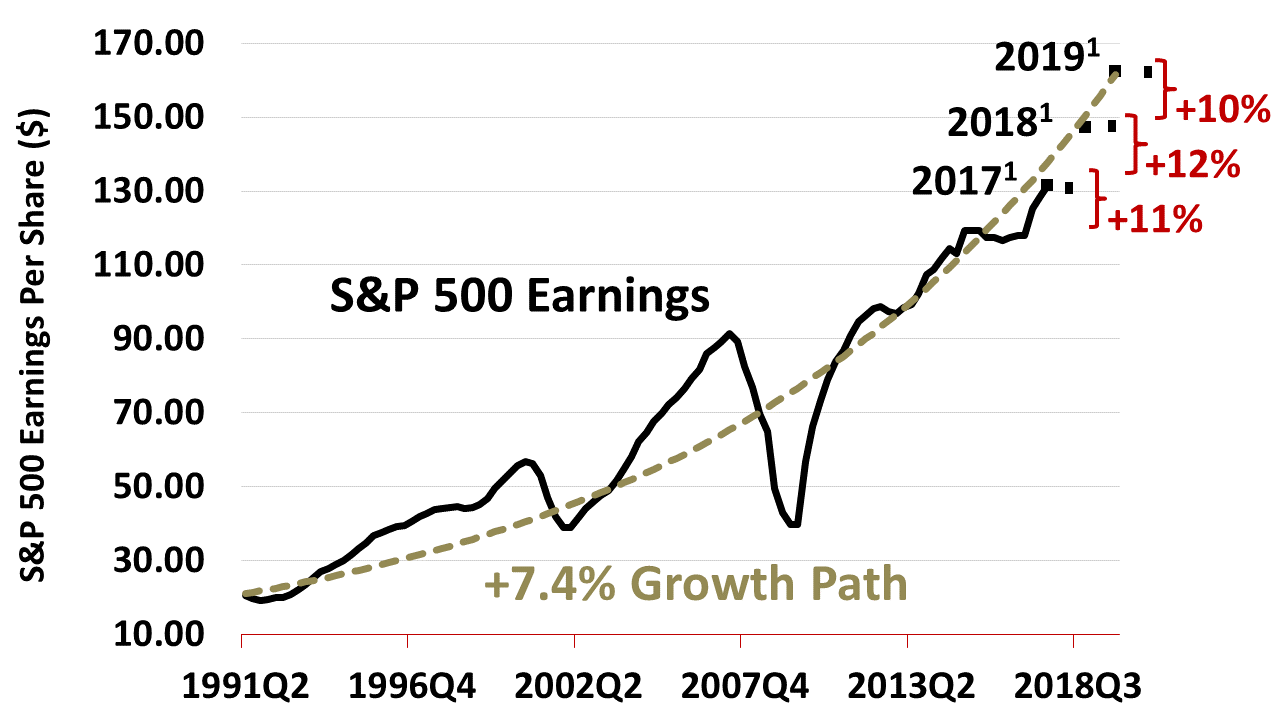
S&P 500 INDEX VS. EARNINGS¥
The earnings picture is bright: Since April 1991, when the decade-long expansion of the 1990s began, profits at large American companies have grown at an average annual rate of 7.4%, and a dollar invested in the average company over this 26-year period averaged a 7.4% total return annually.
Source notes: 1 2017 (estimated), 2018 (estimated) and 2019 (estimated) bottom-up S&P 500 operating earnings per share as of January 5, 2017: for 2017(e), $131.47; for 2018(e), $147.23; for 2019(e), $162.22. Sources: Yardeni Research, Inc. and Thomson Reuters I/B/E/S for actual and estimated operating earnings from 2015. Standard and Poor’s for index price data through 1/5/18 and actual operating earnings data through 2014.
Past performance of investments is not a very reliable indicator of future performance. ± Indices and ETFs representing asset classes are unmanaged and not recommendations for any specific investment. Foreign investing involves currency and political risk and foreign-country instability. Bonds offer a fixed rate of return while stocks fluctuate. Leading economic indicators from the Conference Board. S&P 500 bottom-up operating earnings per share as of January 5, 2017: for 2017(e), $131.47; for 2018(e), $147.23; for 2019(e), $162.22. Sources: Yardeni Research, Inc. and Thomson Reuters I/B/E/S for actual and estimated operating earnings from 2015. Standard and Poor’s for index price data through 1/5/18 and actual operating earnings data through 2016.

