Covington Investment Advisors, Inc. Blog

News, Tips, Commentary, etc.

The Big Get Bigger

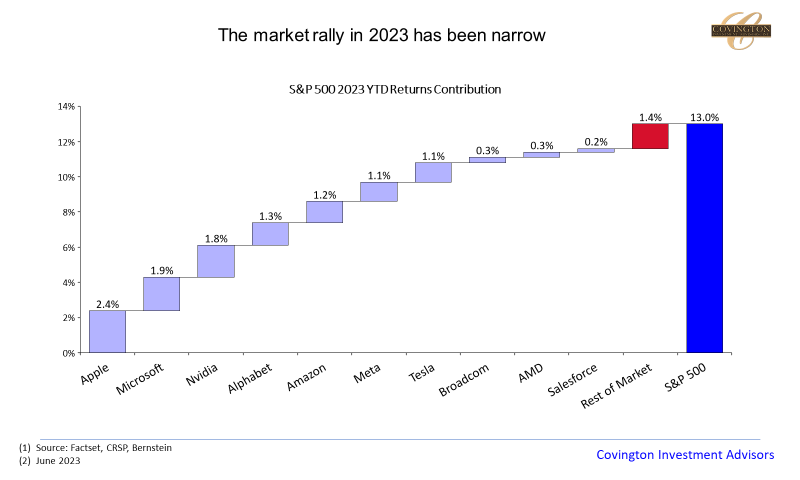
The first half of 2023 has felt very similar to the tumultuous years of 2020 and 2021 which saw the market dominated by mega-cap tech stocks. The average YTD return on Amazon, Apple, Google, Meta (Facebook), Microsoft, Nvidia, and Tesla is 84%. The average YTD return for the rest of the S&P 500 is just 3.7%. In fact, when breaking down the contribution to the index’s total year-to-date returns this chasm becomes even more apparent – ten stocks contribute all but 1.4% of the returns which is shown in today's chart above. This is the most narrow breadth in the market since the tech bubble in the early 2000’s.

What's driving this? A lot of it is optimism over the proliferation of artificial intelligence (AI) and multiple expansion for the previously listed top ten stocks. Many of these are now priced at or near the top end of their historical valuation range which is puzzling considering those previous highs were when interest rates were near 0%. For Meta and Nvidia, sharply increased earnings expectations are also part of the explanation for their meteoric rise this year. For the other five stocks mentioned in the first paragraph of this note, earnings expectations are either flat, or in the case of Tesla projected to fall due to $2k-$10k price cuts for the Model Y, S, and X vehicles (which hasn't prevented Tesla from rising by over 90% in 2023)...

Continue reading

FOUNDER AND PRESIDENT, PATRICK R. WALLACE, COMMENTS ON COMPANY'S 20th ANNIVERSARY

May 10, 2023

Twenty years ago today, Covington Investment Advisors was incorporated. The success we have had with and for our clients has allowed us to grow, hire more talent, continually enhance our technology and research, purchase and expand our building, expand our overall processes to customize your financial plans, providing best in class investment management services and results and contribute to our communities' societal needs.

I do not hesitate to say we have formed the best-in-class advisory firm as we are not a broker dealer, nor are we affiliated with one. As an independent advisor, we have an open architectural structure to find the best financial solutions for you. We cut out all the unnecessary middlemen and their fees and we refuse any form of commissions. We are a fee-based only advisory firm. We do not sell products; we provide customized financial plans structured and managed on a separate account basis driven to address your individual investment and family needs. As a federally registered investment advisor with the Securities & Exchange Commission’s (SEC) oversight, we are a corporate fiduciary held to the highest standard of care...

Continue reading

Beware of AI

Financial advisors and their clients must stand guard at AI’s gate.

In a quote whose origin has been misattributed to Mark Twain and Benjamin Franklin, it was Christopher Bullock writing in 1716’s “The Cobbler of Preston” who first noted, “’Tis impossible to be sure of anything but death and taxes.”

Fast forward 307 years, and we are forced to include computer-generated misrepresentations. And this modern malady is legion, and insidious, in so many things we do...

Continue reading

Asset Protection at Schwab

Recent headlines on the banking crisis have most likely brought up questions on the safety of your money and assets. This blog will hopefully clarify those concerns.

Charles Schwab, like all federally registered regulated banks, has insurances in place to offer additional protection to their customers. In summary, there is SIPC insurance which covers up to $500,000 in cash and securities per account holder - $250,000 limit for cash. SIPC covers account holders if the firm fails and cannot return assets and covers unauthorized trading or theft of their securities. Additionally, Schwab has FDIC insurance which traditionally covers up to $250,000 per account holder in deposit accounts like bank sweep products and CD’s should a bank fail. In the case of Silicon Valley Bank, FDIC made exceptions and guaranteed ALL deposits – so the limit of $250,000 is up for interpretation. Lastly, Schwab has in place “excess SIPC” insurance of $600M for securities and cash if the first two programs are exhausted.

Here is a link that explains the account protections that Schwab has in place: Is my money safe - Account Protection | Charles Schwab..

Continue reading

150 Years of US Recessions

Not a barcode… Today's chart plots the frequency and duration of every post-Civil War recession in the United States. If the year has a blue bar that indicates the US economy was in a recession or decline in business activity for the period.

As the Fed embarks on their capital tightening cycle to tame inflation we are likely nearing the end of this expansion pointing to perhaps one of these blue bars appearing in the next 6-12 months. In past notes we have hinted at the likelihood of this occurring and what it would mean for asset prices and long term investment portfolios. See here, and here...

Continue reading

The Tide Goes Out On Silicon Valley Bank

I am sure by now you have seen the headlines of the failure of Silicon Valley Bank (SIVB). Our President wrote a letter on Monday (here) touching on the situation but also outlining what we are prepared for as we progress through this broader economic cycle. In this note I want to expand on that letter and give a more specific commentary on what took place at Silicon Valley Bank and how it reached the point of collapse. In this note I focus on SIVB but the same characteristics are shared by Signature Bank (SBNY) and First Republic (FRC) which have also gone under or are under significant stress.

Silicon Valley Bank is a chartered bank in Santa Clara California. In many ways SIVB operated like any normal bank. A classic bank has short-term deposits and long-term assets. Depositors loan their money to the bank for an interest rate payment. That bank then loans that money to fund useful projects that earn a higher interest rate payment (typically in bonds, stocks, loans, mortgage backed securities, etc). As long as the depositors do not withdraw their funds, the bank earns a profit. The deposits are liabilities to the bank and the loans are assets to the bank. All banks also use a fractional reserve system where they only hold a fraction of their deposits in liquid “cash”. The fractional reserve system is often characterized as a sinister system but it’s the main vessel of money creation in our modern economy. The drawback is if enough depositors rush to the bank to withdraw their money at the same time you get a “run on the bank” leading to a collapse of that bank. The FDIC tries to mitigate the risk of this by guaranteeing up to $250k of a depositor's money so as to provide confidence to depositors that their savings will not just vanish. Since Friday the federal government announced protections for depositors at SIVB above the $250K limit. But as can be inferred from this whole dynamic, a bank run can be a self-fulfilling prophecy where if key depositors withdraw their funds from the bank, that can scare other depositors into withdrawing their money ultimately resulting in a state regulator to call in the bank and dissolve it.

So SIVB pretty much followed this typical bank failure model but with some nuance which gives hints as to what is happening to the broader economy. SIVB saw a huge inflow of deposits in the last 3 years as their client base of speculative tech companies have been perhaps the main beneficiary of the fiscal and government stimulus policies. SIVB received this huge inflow of deposits from their technology/VC/crypto clients and they could not figure out how to invest all those funds into high yield assets since rates were so low. Thus, SVB ended up purchasing low-yield, long duration, but relatively safe mortgage backed securities and long term bonds that were intended to be held to maturity (HTM)...
Continue reading

Fed Policy Change Designed to Break Current Economic Expansion

Business cycles are intervals of expansion followed by slowing growth or a recession in economic activity. These cycles are driven by many macroeconomic factors, but our government policies serve as the governor to the economic engine.

Current Fed policy measures are being implemented to break the current economic expansionary phase of this economic cycle. Yes, the Fed wants to break this exuberant economy and slow it down to mitigate the pressures of accelerated inflation. With the government actions to save us from COVID the economy has been running too hot. 500,000 new jobs created in January followed by 300,000 new jobs in February with 10.8 million current job openings posted the Fed has no choice but to take aggressive action to normalize growth and purge excesses from the economy.

Warren Buffet said it best about the effects of such measures: “It is at these times that when the tide of economic expansion runs out to sea we see who is swimming naked.” When liquidity, or access to capital, is fluid and cheap all kinds of companies thrive. When capital is pulled from the economy and becomes expensive profit margins suffer. Strong businesses with sound fundamentals survive while the weak and unproven enterprises perish. This is why I have always professed that we invest in proven enterprises with strong economic fundamentals...

Continue reading

Debt Ceiling Deja Vu

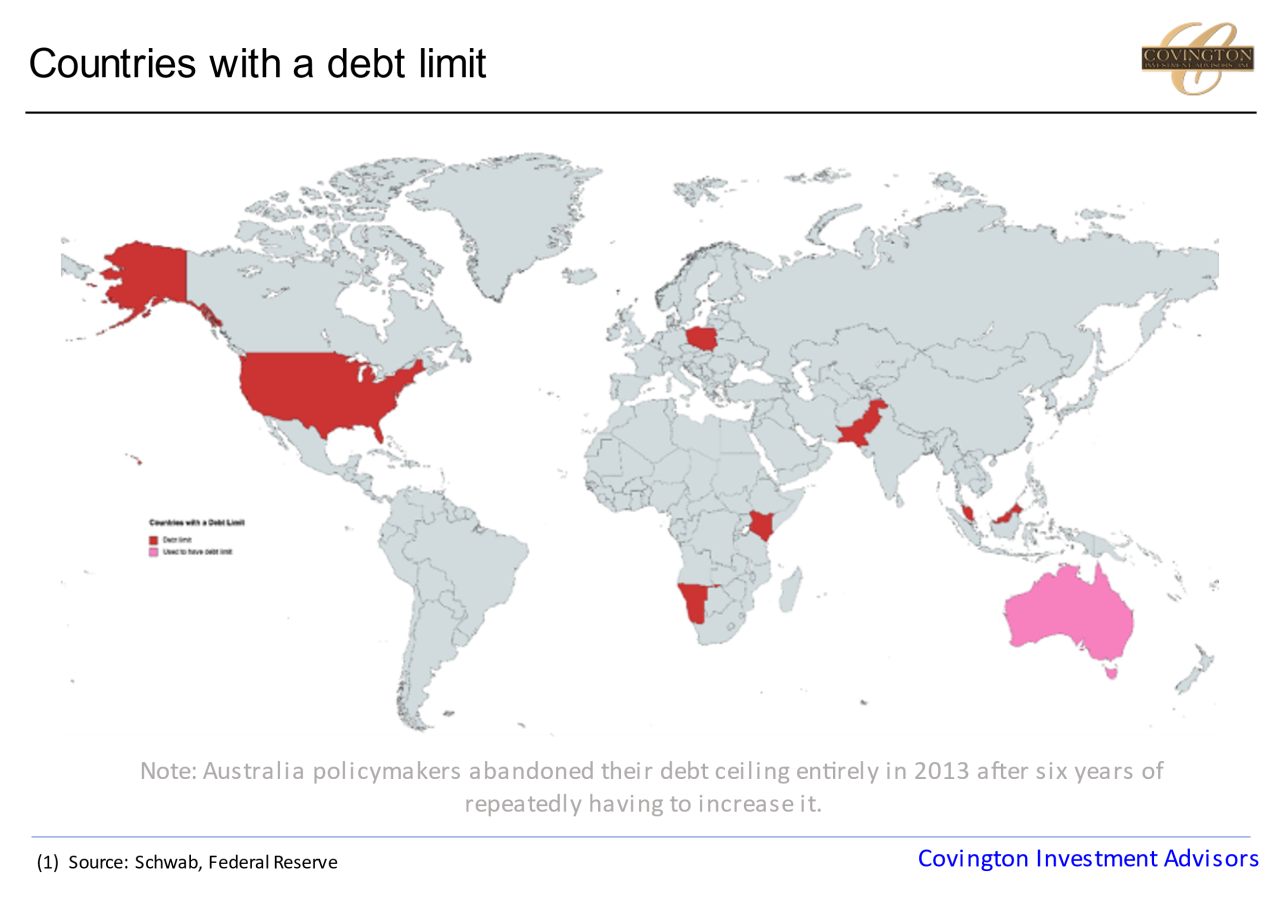
Not quite as salient in markets as inflation, but certainly occupying the headlines has been the pending battle on raising the debt ceiling. Congress has always placed restrictions on federal debt. These limitations have helped Congress assert its constitutional powers of the purse, of taxation, and of the initiation of war. Since WWII, Congress has raised the debt limit 78 times and suspended it another five times. For most of the post-war period debt limit increases were considered routine legislative chores that never engendered much debate or public scrutiny. The current debt limit of roughly $31.4 trillion was reached this quarter prompting the discussion to begin on raising the debt limit in order to maintain the country's spending habits. You'll remember we went through a similar episode in 2021 when the debt limit was reached and subsequently raised but only by enough to prevent a default until the beginning of this year -  Thus here we are now having the current debate.

A deeply divided congress still has five or six months to reach a deal on raising the limit and avoiding a default or funding delay in the US treasury market, which is an integral component in the global financial system. Both sides are dug in early with Republicans saying they won't agree to a debt limit increase unless it accompanies spending cuts (although most spending appears to be off the table). Democrats say they will only support a debt limit increase without cuts or other changes. You'll remember in the 2021 episode which we wrote about at the time (here), both sides of congress used the element of political brinkmanship which rattled investors. This involves waiting until the very possible last moment, but ultimately hammering out a deal because they realize the consequences of not doing so would be catastrophic. We never like to assume, but feel that the situation this time around will play out similarly. For politicians there is no reason not to take things right down to the wire like they did in 2021. A government shutdown might even take place which does not affect markets much if it only lasts a few weeks...

Continue reading

Economic Whiplash

Deflation in 2020/21. Inflation in 2022 … Stagnation in 2023?

During the covid lockdowns starting in 2020 deflation dominated markets as economic velocity and prices plummeted. US treasury yields fell to an all-time low bumping under 0.5%, growth stocks soared, and speculative phenomena such as NFTs and crypto went mainstream. During this time the US tech sector market cap rose to over $7 trillion...

Continue reading

Holiday Economic FAQs

As we reflect back on a tumultuous 2022 and begin to look forward to 2023 we are not only preparing for our new year outlook but also what topics are on everyone's minds, including our own, over the holidays. We have listed the notable questions and what our take is on each one, both a short answer and a more nuanced view. So if the economy comes up in those lively holiday conversations hopefully these provide some interesting discussion material.

  1. “Are we in a recession? We have had two consecutive quarters of negative GDP growth this year, isn't that a recession?”

Short answer:Not yet. 

Long Answer:  Although two quarters of falling GDP meets the definition of a “technical recession”, from an economic perspective weakness has to broaden out to a wider range before it meets the criteria for an official recession. The National Bureau of economic research (NBER) makes the official call on whether the economy is in a recession. To do this they use 6 economic indicators which are more expansive than just GDP which can be impacted by large swings in trade and inventory data (which we have seen this year). ..

Continue reading

Laurel Highlands Workforce & Opportunity Center-Ribbon Cutting Ceremony

At Covington our primary focus has been meeting our clients’ financial goals and secondarily to make a difference in our community. Meeting our clients’ financial goals has enabled us to participate in a number of community efforts for the betterment of the human experience. On November 11th, 2022, I had the privilege of hosting a ribbon cutting ceremony at the newly established Laurel Highlands Workforce & Opportunity Center celebrating the Center’s successful operations and its first class of cohorts studying to become Medical Assistants. The Center is located at 310 Donahoe Road, Greensburg, PA 15601. Feel free to visit the website at https://lhwoc.org for more information.

Patrick Wallace (middle) cuts the ribbon at the Laurel Highlands Workforce & Opportunity Center ribbon cutting ceremony. ..

Continue reading

Q3-2022 Quarterly Newsletter

More Pain To Endure

There is no doubt that this has been one of the most difficult years in recent memory for many investors. Nearly every equity index has fallen below the definition of a traditional bear market, a decline of 20% or more. Equally difficult has been the performance of the bond market which is supposed to insulate portfolios from market volatility. Even commodities, which started the year strong with heightened geopolitical activity, have begun to roll over. Crude oil has fallen -25% during the third quarter of 2022 and -35.7% since its March peak. Under restrictive Fed policy to mitigate heightened inflation, we will have to endure the pain until the Fed completes their mandate of price stability.

What has been behind the weakness in the market is above average inflation and a major shift in Fed policy. Nominal GDP has been very strong, up 8.5% in the first quarter and up 6.6% in the second quarter. After inflation though, real GDP is trending negative. Inflation, as measured by the Consumer Price Index, has come down from its peak of 9.1% in June of 2022 but still remains up over 8%, well above what the Fed considers its “neutral” rate of around 2.5%. In response to stubbornly high inflation, the Fed Funds rate has been increased five times so far in 2022 to a range of 3.00% to 3.25%. We anticipate two more hikes before year end which will leave the Fed Funds rate at a target of around 4.5%. We anticipate Fed policy may be able to transition sometime in early 2023 depending on the inflation data...

Continue reading

Where is the Fed's Peak

Inflation data continued to surprise to the upside with last week's CPI reading shocking markets and lead the Federal Reserve to announce another 75bps rate hike yesterday. The fed funds rate is now in the target range of 3% to 3.25%. In our opinion inflation has likely peaked but remains elevated enough that a quick dovish pivot by the central bank is not in the cards. You'll remember from our note last year (here) that when the Federal Reserve begins tightening policy and raising interest rates it is essentially the economic equivalent to a punch bowl being pulled away at a party. While we were not surprised that the Fed was tightening policy we have been surprised by the speed of policy change. For perspective, at the beginning of the year markets were pricing in a federal funds rate at sub 1%, now futures markets are pricing in a rate above 4% for 2023.

So now that we have embarked on a changing policy journey, where does it end?The truth is I don't think even Chairman Powell knows the answer as to what the terminal rate will be in a year. Like mentioned previously the market sort of does this for him by pricing in the terminal rate years ahead using futures contracts. Still, the procedure for central banks has always been more of a guess-and-check process where they begin raising rates until something in the market forces them to reverse course. On our chart today I plot some of these events and you can see they are wide ranging as far as which area of the market is most affected and ends up defining the tightening period. But one thing is common amongst them: most are pockets of excess where prices became irrational. Also notice how many of these are relatively illiquid or obscure with many taking place in emerging or debt markets...

Continue reading

Hard or Soft Landing?


Economic growth spiked coming out of the pandemic trough in 2021 with the aid of aggressive fiscal & monetary support. Late in 2021 that growth began to cyclically slow down leading to volatility in the first half of this year followed by sizable rallies and selloffs. The selloffs have been exacerbated by geopolitical shocks, tightening monetary policy, and inflation. The rallies have been characterized by optimism that these sources of contention are showing signs of dissipating amid record low sentiment in equity pricing. At the center of these contentions is inflation. High inflation is typically an offshoot of strong economic activity and loose monetary policy. Symmetry implies that a slowdown in economic growth should coincide with a peak in inflation which would be a welcomed respite for investors allowing the Fed to lighten up on rate hikes. This “dovish pivot” was the root of the 17% rally in the S&P 500 in mid-June through mid-august, but the crux of this optimism is that slowing economic growth risks a recession and the inflation we are experiencing now is unique in many ways. In response to this Fed chairman Powell’s recent comments at Jackson hole sent equity markets lower after this dovish pivot never materialized. On the contrary Powell's speech was short, but explicit in relaying the central bank’s commitment to fighting inflation even at the risk of recession...

Continue reading

Where is the Fed's Peak

Inflation data continued to surprise to the upside with last week's CPI reading shocking markets and lead the Federal Reserve to announce another 75bps rate hike yesterday. The fed funds rate is now in the target range of 3% to 3.25%. In our opinion inflation has likely peaked but remains elevated enough that a quick dovish pivot by the central bank is not in the cards. You'll remember from our note last year (here) that when the Federal Reserve begins tightening policy and raising interest rates it is essentially the economic equivalent to a punch bowl being pulled away at a party. While we were not surprised that the Fed was tightening policy we have been surprised by the speed of policy change. For perspective, at the beginning of the year markets were pricing in a federal funds rate at sub 1%, now futures markets are pricing in a rate above 4% for 2023.

So now that we have embarked on a changing policy journey, where does it end?The truth is I don't think even Chairman Powell knows the answer as to what the terminal rate will be in a year. Like mentioned previously the market sort of does this for him by pricing in the terminal rate years ahead using futures contracts. Still, the procedure for central banks has always been more of a guess-and-check process where they begin raising rates until something in the market forces them to reverse course. On our chart today I plot some of these events and you can see they are wide ranging as far as which area of the market is most affected and ends up defining the tightening period. But one thing is common amongst them: most are pockets of excess where prices became irrational. Also notice how many of these are relatively illiquid or obscure with many taking place in emerging or debt markets...

Continue reading

Q3-2022 Quarterly Newsletter

More Pain To Endure

There is no doubt that this has been one of the most difficult years in recent memory for many investors. Nearly every equity index has fallen below the definition of a traditional bear market, a decline of 20% or more. Equally difficult has been the performance of the bond market which is supposed to insulate portfolios from market volatility. Even commodities, which started the year strong with heightened geopolitical activity, have begun to roll over. Crude oil has fallen -25% during the third quarter of 2022 and -35.7% since its March peak. Under restrictive Fed policy to mitigate heightened inflation, we will have to endure the pain until the Fed completes their mandate of price stability.

What has been behind the weakness in the market is above average inflation and a major shift in Fed policy. Nominal GDP has been very strong, up 8.5% in the first quarter and up 6.6% in the second quarter. After inflation though, real GDP is trending negative. Inflation, as measured by the Consumer Price Index, has come down from its peak of 9.1% in June of 2022 but still remains up over 8%, well above what the Fed considers its “neutral” rate of around 2.5%. In response to stubbornly high inflation, the Fed Funds rate has been increased five times so far in 2022 to a range of 3.00% to 3.25%. We anticipate two more hikes before year end which will leave the Fed Funds rate at a target of around 4.5%. We anticipate Fed policy may be able to transition sometime in early 2023 depending on the inflation data...

Continue reading

..
Continue reading

Market Valuation and Volatility


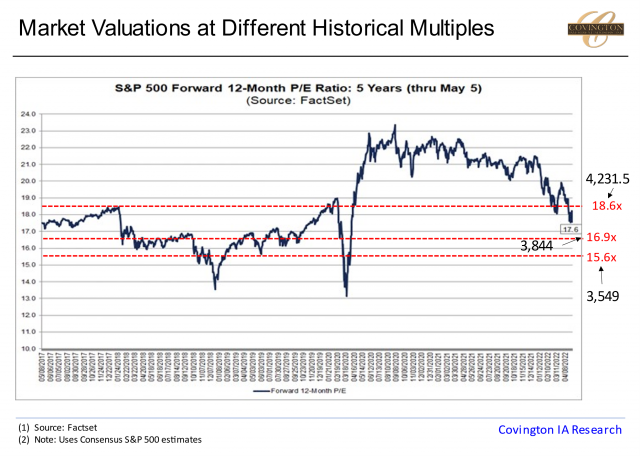
With the dramatic compression in valuation multiples this year we can now start to plot the current positioning of the market versus historical averages to gauge whether or not equities are attractive. On the graph above I have the forward 12 month P/E ratio of the S&P500 which currently stands at 17.6x and represents a level of 4,029. Overlapped on the chart I have 5, 10, and 15 year average multiples along with corresponding S&P 500 prices...

Continue reading

Most Recent Blog Posts

17 April 2024
20 March 2024

Connect With Us


Covington Investment Advisors, Inc.
301 E. Main Street
Ligonier, PA 15658
Phone: 724-238-0151
Fax: 724-238-0148
Email: covington@covingtoninvestment.com

This website uses cookies for navigation, content delivery and other functions. By using our website you agree that we can place cookies on your device. I understand