Market Data Bank
Click image to enlarge
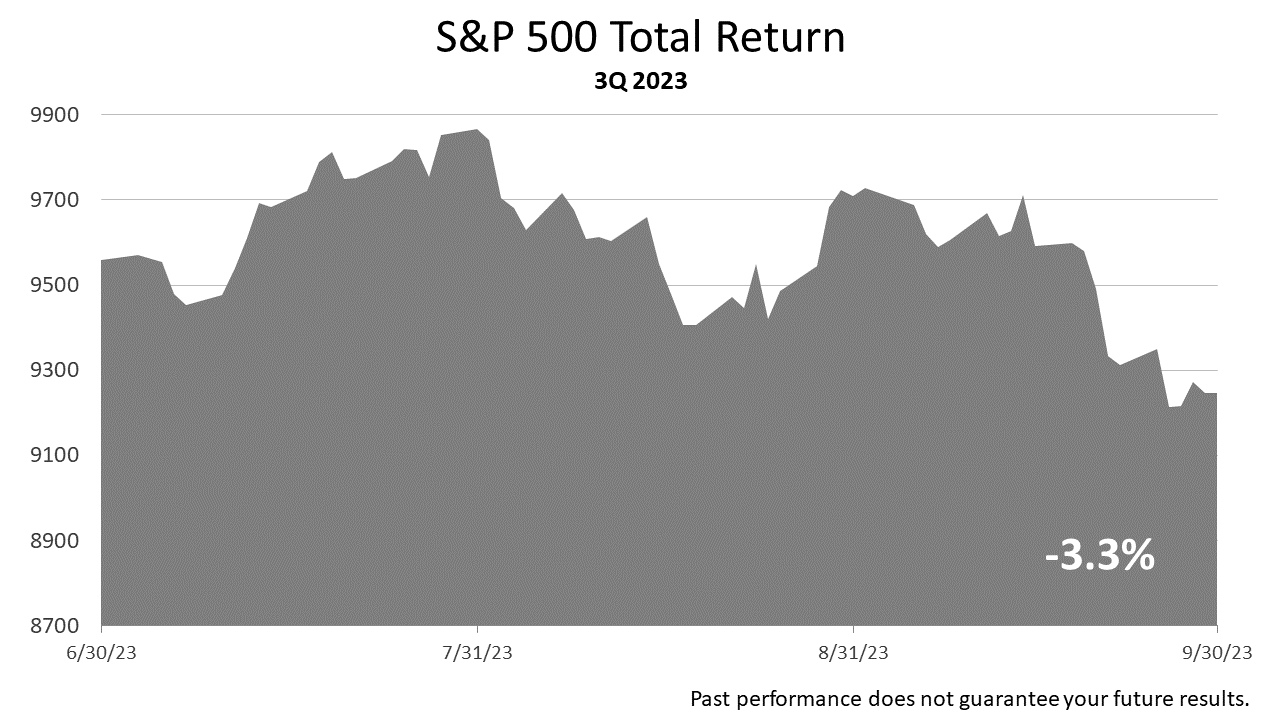
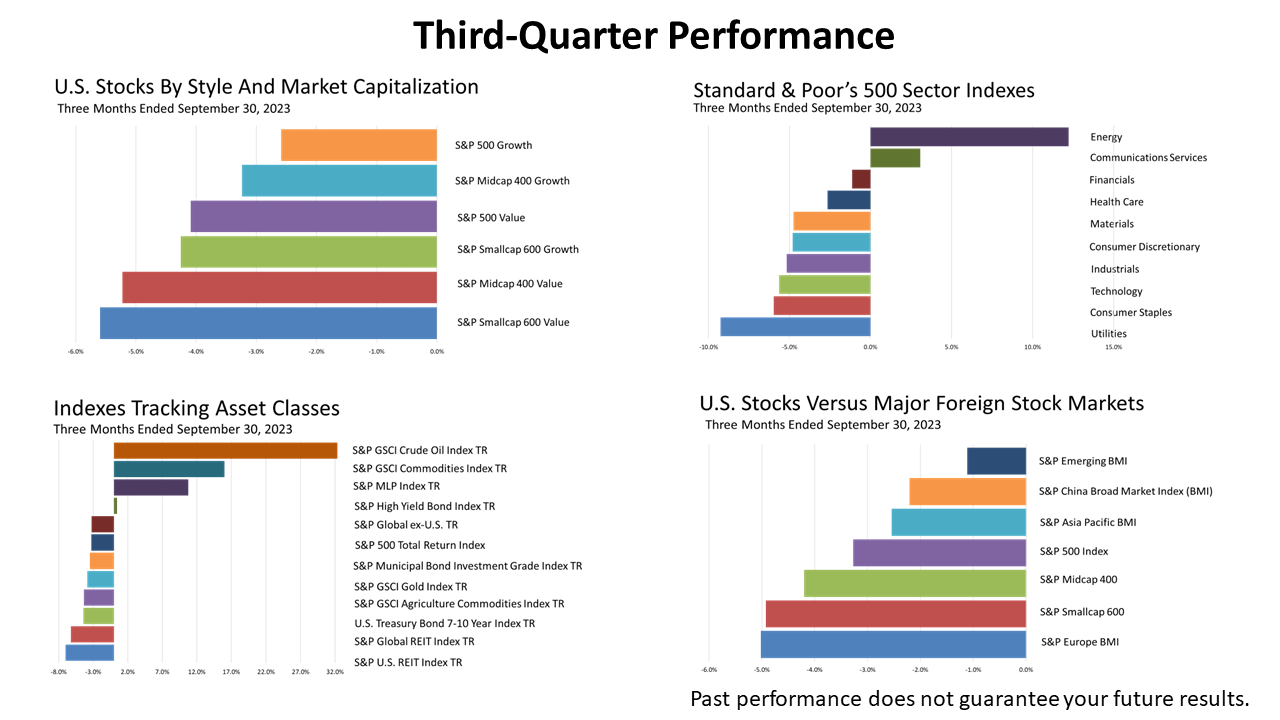
Stocks posted a -3.3% loss in the third quarter.
Click image to enlarge
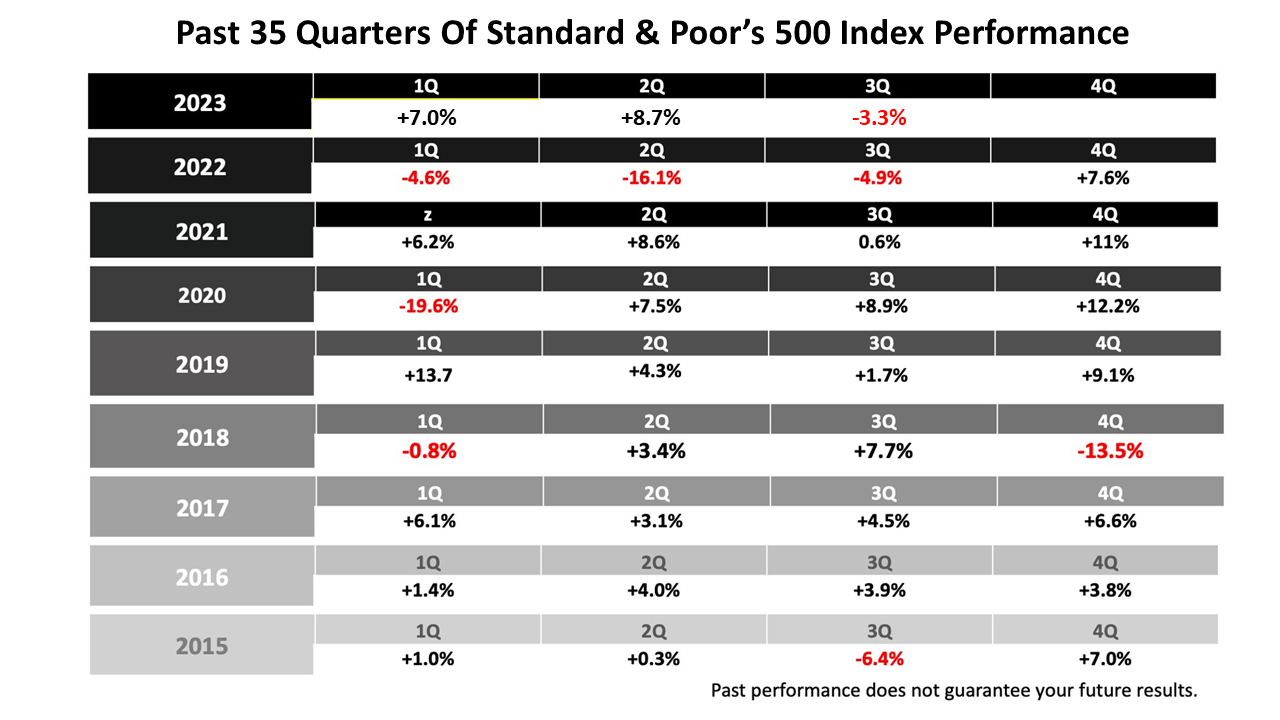
Keep in mind, the gains in the three previous quarters were much stronger than 2.5% averaged quarterly since 1926.
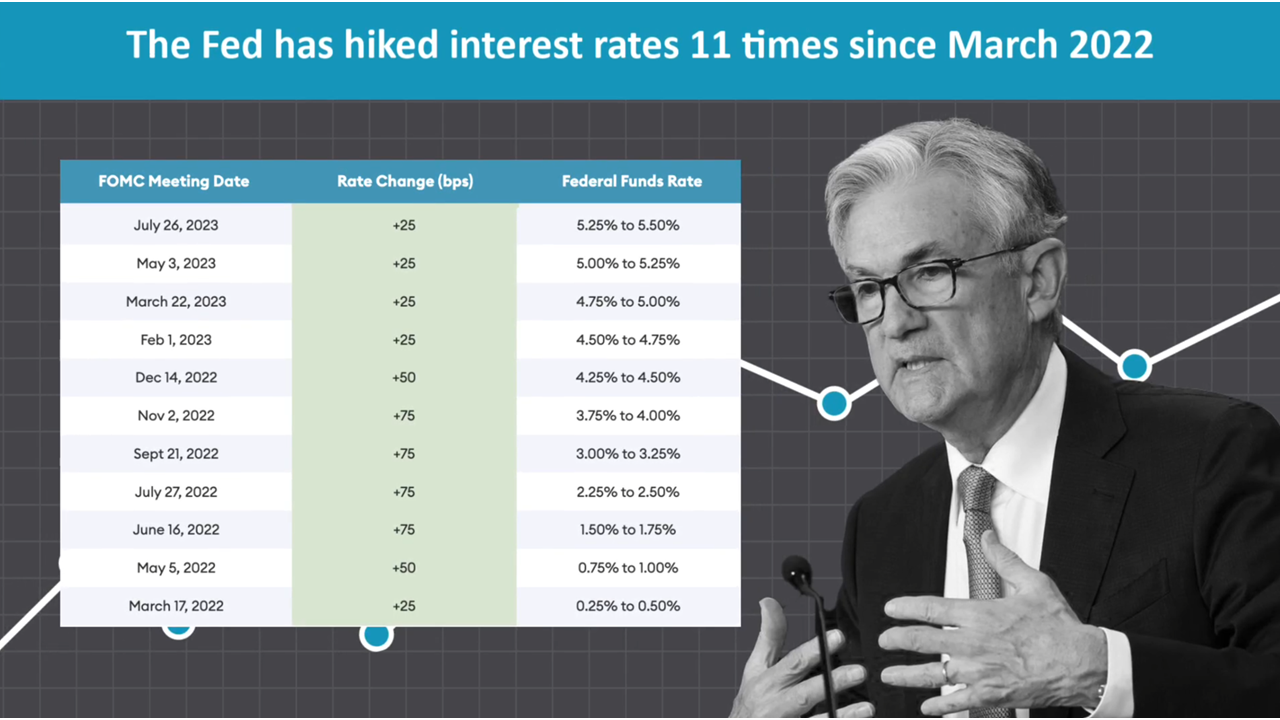
Stock prices were hurt in the third quarter by the rise in interest rates.
Click image to enlarge
The Federal Reserve Board, the nation’s bankers, has raised the fed funds rate – the rate at which the Fed makes short-term loans to banks – 11 times in the 18 months from March 2022 through the end of the third quarter on September 30, 2023.
The 11 rate hikes represent the most aggressive monetary tightening campaign by the Fed in modern U.S. history.
Raising the fed funds rate forces banks to raise the cost of lending to businesses, as well as the cost of credit card debt and other loans to consumers.
At this stage of previous economic cycles, the elevated cost of credit leads more businesses and consumers to default on their loans.
As a result of higher defaults, banks must tighten loan standards, and credit becomes much harder to get.
Click image to enlarge
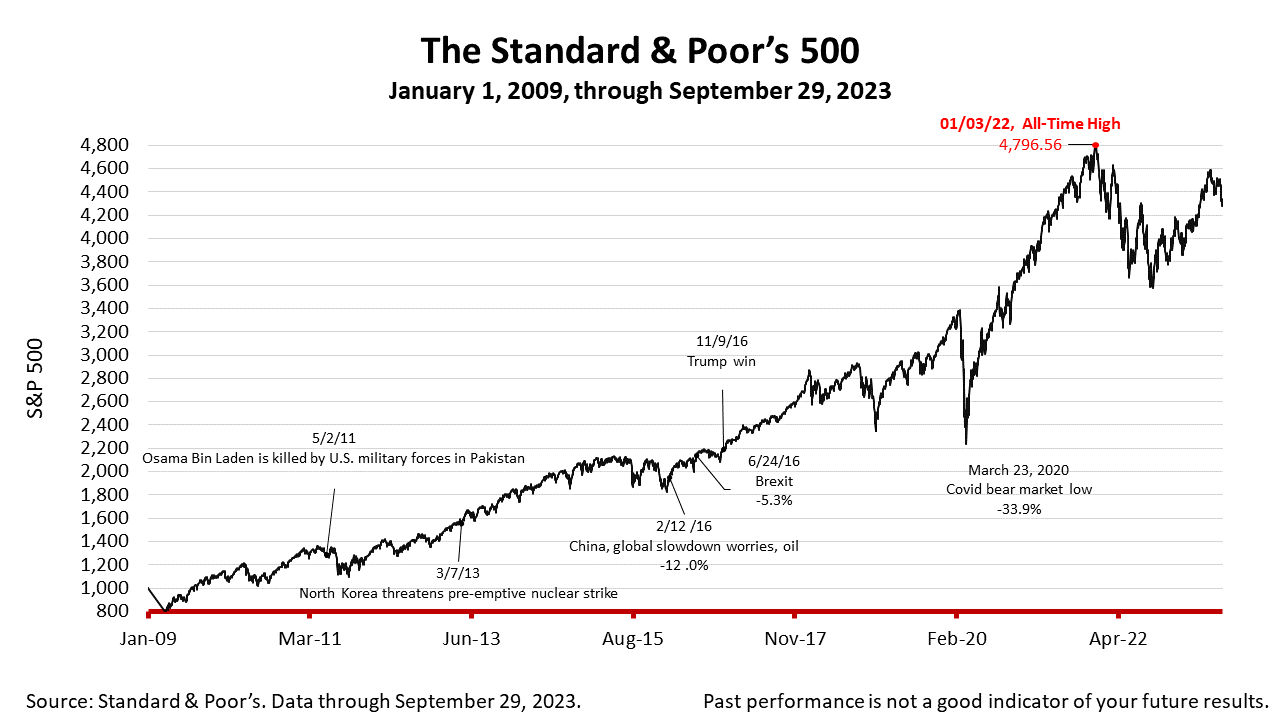
The stock market always reflects what’s going to happen over the coming months, so long as nothing unexpected happens.
It already reflects a slowdown in economic growth that’s expected to result from tighter credit conditions.
The third quarter ended Friday, September 29, 2023, with the Standard & Poor’s 500 stock index at 4288.05.
A gain of +91.65% from the March 23, 2020 bear market low, and -10.6% below the all-time high price of January 3, 2022.
Amid the stock market’s losing third quarter, remember that the S&P 500 index rose +8.7% in the second quarter of 2023 and +7% in the first quarter of 2023 – much stronger quarterly gains than +2.5% averaged annually on large-company stocks since 1926.
Moreover, economic growth is strong.
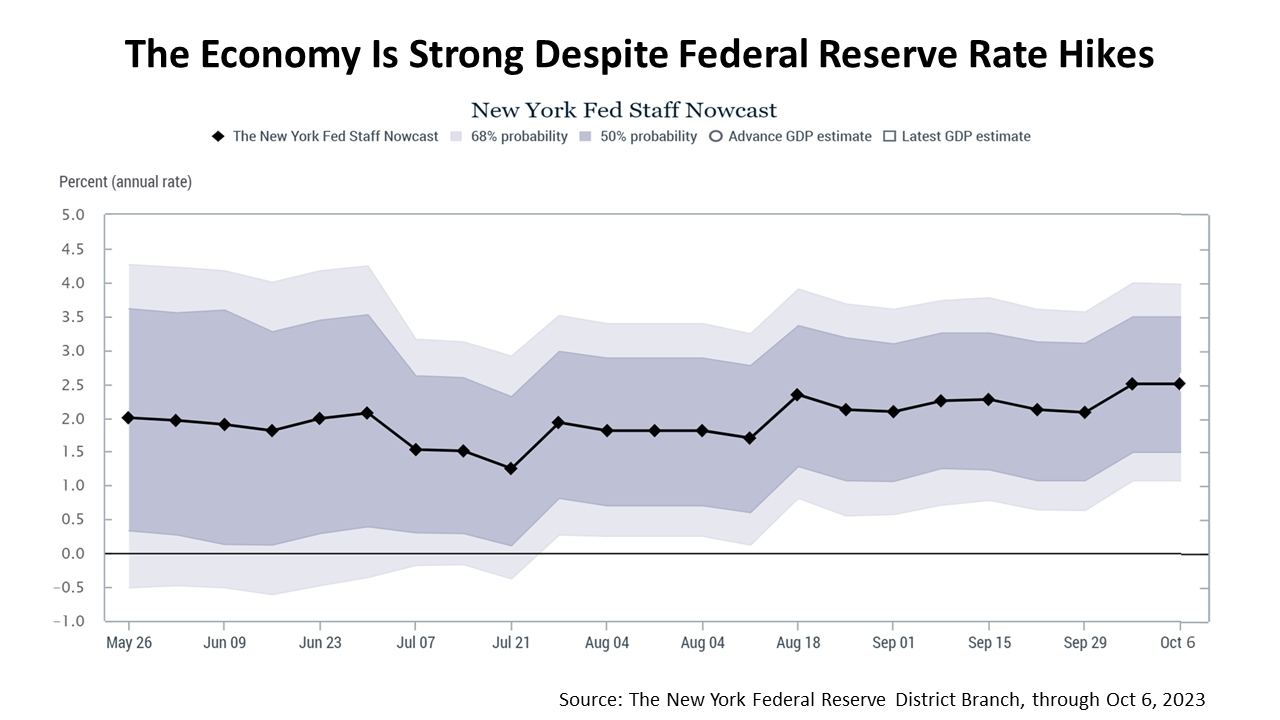
Click image to enlarge
The New York Fed’s GDPNow algorithm, as of October 6, projected a gross domestic product growth rate for the third quarter of 2023 of +2.1%.
GDPNow is an algorithm built by the staff at the New York Federal District Branch to estimate U.S. GDP growth in real time.
The official U.S. GDP growth rate will not be announced in final form until the end of the next quarter.
Three estimates of GDP growth are announced before the final GDP growth is released – three months after each quarter ends.
In recent months, two of the 12 district branches of the Fed began estimating GDP as each quarter is in progress.
On days when data are released or on a weekly basis, the Atlanta and New York Fed branches have begun what are called “Nowcasts,” economic estimates of the current quarter’s growth rate based on algorithms written by their staff economists.
The emergence of Nowcasts is an example of what makes America exceptional, but that’s a subject for another time. The main point is that a +2.1% growth rate after 11 hikes in rates in the past 18 months would be strong.
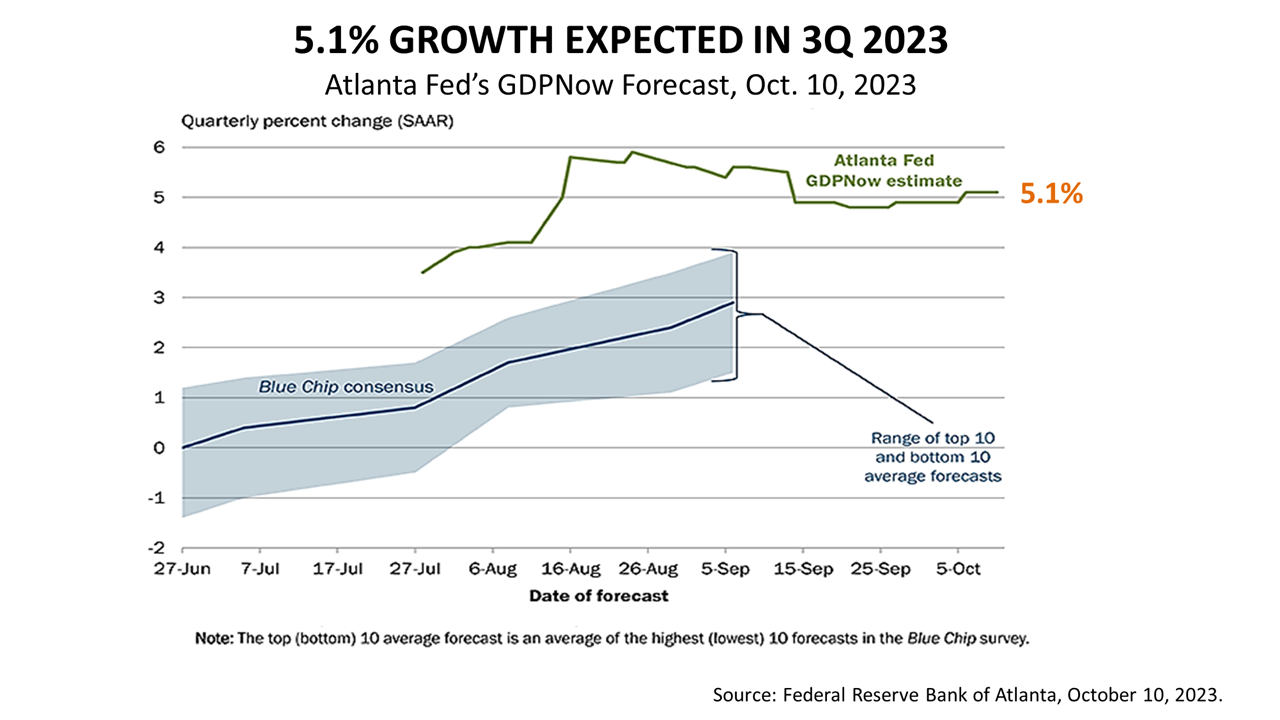
Click image to enlarge
But listen to this:
The Atlanta Fed’s GDPNow algorithm projects the final third quarter economic growth rate will rise by +5.1%!
That’s much higher than what was “normal” before the pandemic!
To be clear: Despite the anomalies and high rates, the Atlanta Fed’s staff’s algorithm projects a third quarter estimated growth rate of +5.1%.
This is a good sign.
When the third quarter began on July 1, 2023, the consensus forecast of economists surveyed by Blue Chip Economics, shown in the blue line above, estimated the economy would shrink.
Since the middle of 2022, the consensus forecast of 60 of the nation’s leading economists, surveyed quarterly by The Wall Street Journal, was for a recession.
All through this period, GDP growth beat expectations of both the Blue Chip and WSJ surveys of economists.
The Atlanta Fed’s algorithm has been fairly accurate in the post-pandemic period.
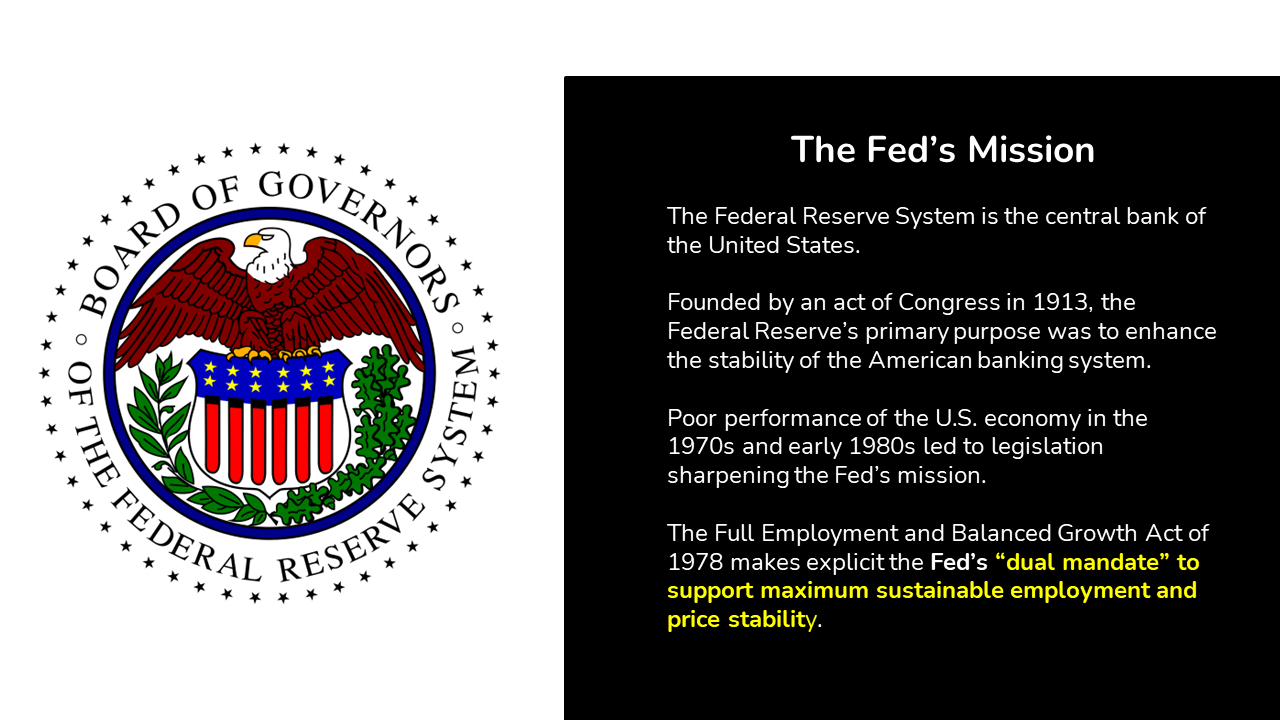
Click image to enlarge
The Fed’s tight money policy is driven by its Congressionally-mandated mission — pursuing maximum employment and price stability.
Price stability is Fed-speak for inflation.
2023 will be remembered in financial history for the worst inflation cycle in four decades.
High inflation is one of many anomalies that upended the financial economic outlook in February 2020, and it has defined the post-pandemic era ever since.
Spawned amid the partial shutdown of the economy, post-Covid financial anomalies include several trillions of government stimulus payments to consumers and businesses in 2021 and 2022, which quelled fears of financial disaster and liquefied the economy.
Then came the Federal Reserve’s monetary policy of quantitative easing, along with the Fed hiking its lending rate more than 1000% from March 2022 through October 2023.
Now, post-pandemic anomalies are fading, and a 10-year Treasury bond is back to yielding almost as much as a 90-day Treasury bill, and things are getting back to normal – back to a time much more like the 95 years before the pandemic.
Click image to enlarge
A single quarter of performance data does not mean so much.
Whether you’re 30 or 90, if you are investing for retirement, you’re a long-term investor – pretty much a permanent investor.
If your portfolio must last your lifetime and leave as much as possible to your spouse, children, and other heirs, you’re playing the long game, and a single quarter is not enough statistical information to draw conclusions from or to make investment decisions.
But there are 97 years of performance data on investments in the stock of large U.S. companies. Stocks, for nearly a century, have averaged a 10% calendar-year return.
And over the past 97 years, permanent investors who held stocks for 25 years have fared pretty well.
If you plan to hold investments and try to get in and out, the market is a risky bet to make with your life savings.

Click image to enlarge
We give investment advice predicated on modern portfolio theory.
MPT is a large body of financial knowledge based on academic research done over the last 70 years.
This framework for investing is now taught in the world’s best business schools and embraced by institutional investors.

Click image to enlarge
To reduce MPT down to basics, MPT is a way of limiting the risk of losing money for investments you commit to holding until you die, or for at least a couple of decades.
The world that investments revolve around is always changing, and not enough statistical history exists to make investment predictions with certainty.
MPT is a framework for managing that risk.

Click image to enlarge
MPT is a quantitative approach to investing and is based on statistical facts at the intersection of investing and economics.
What’s happened in the past is relied upon to come up with an investment outlook based on economic fundamentals.
But it requires an understanding of the history of investing and economics.
MPT does not guarantee success, but its logic is embraced by pension funds and other institutional investors – the largest investors in the world.
In addition to classifying investments based on their distinct statistical characteristics, MPT imposes a quantitative discipline for managing assets based on history and fundamental facts about finance.
On top of the statistical knowledge about how assets behave based on MPT, a layer of knowledge of history and experience is added.
That layer is professional judgment, and it’s a distinguishing characteristic of this firm.
With that context, let’s look at key investment performance analytics.
Click image to enlarge
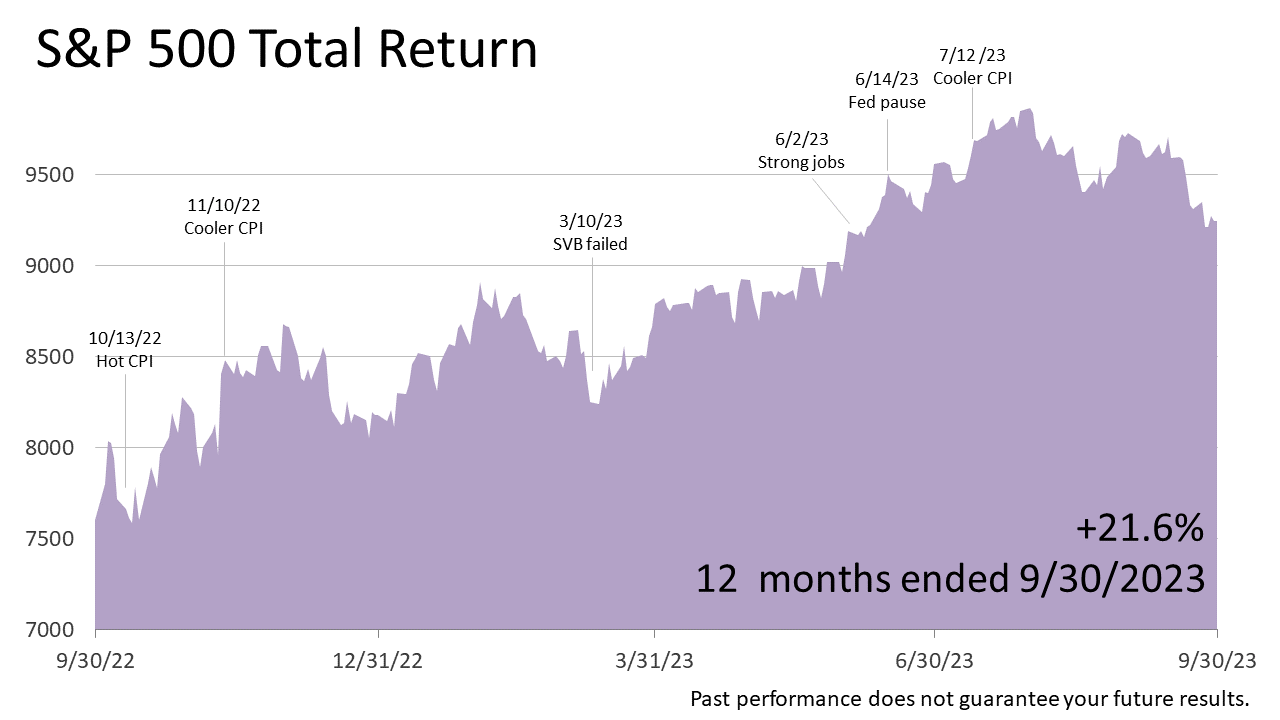
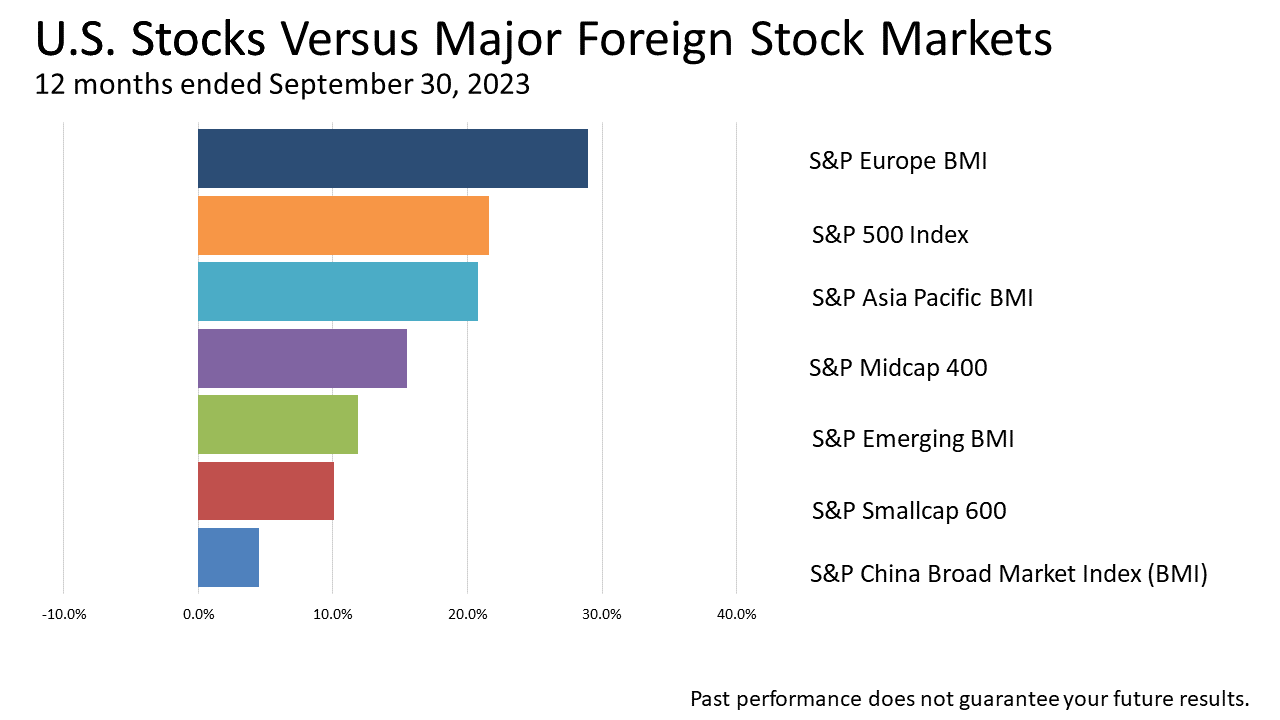
In the 12 months ended September 30, 2023, the Standard & Poor’s 500 stock market index gained twice the 10% average annual return on large-company stocks over the past 97 years.
The bull run was powered by a stronger-than-expected economy.
Month after month, the economy created more jobs than expected, and job creation means more people will be employed full-time and earning income.
More employment means more income, and that leads, of course, to more spending. And consumer spending accounts for 70% of U.S. economic growth, which drives corporate earnings.
Click image to enlarge
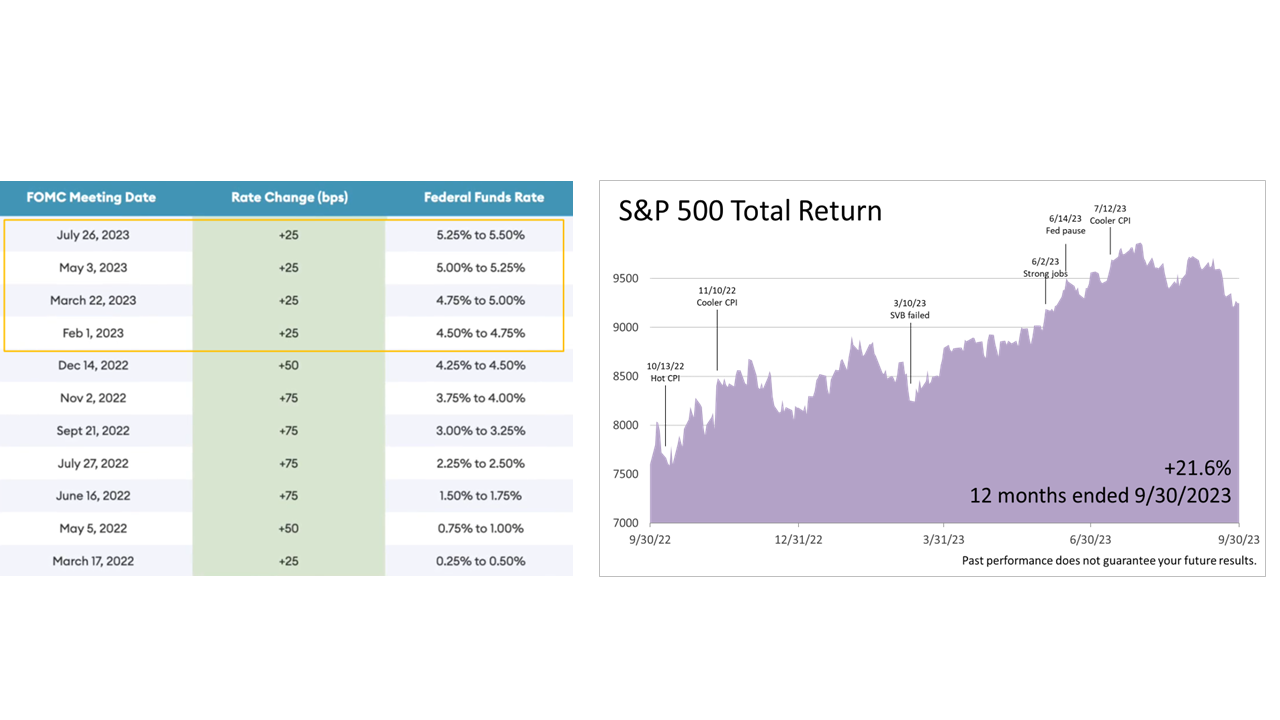
During the 12 months shown, the Federal Reserve hiked interest rates four times to put an end to inflation.
It was the second leg of its tight-money policy designed to slow growth of the economy.
Most recessions are caused by overly aggressive Fed policy mistakes.
When the Fed tightens credit too much, it causes a recession — defined as two quarters of negative gross domestic product (GDP).
And since GDP growth drives earnings growth, a shrinking GDP shrinks corporate earnings, and share prices for stocks also shrink.
During the 12 months shown, while the Fed was raising rates to shrink GDP growth, the economy grew at a rate that was considerably higher than expected.
It’s been a complete fake-out to all the experts and pundits.
Click image to enlarge
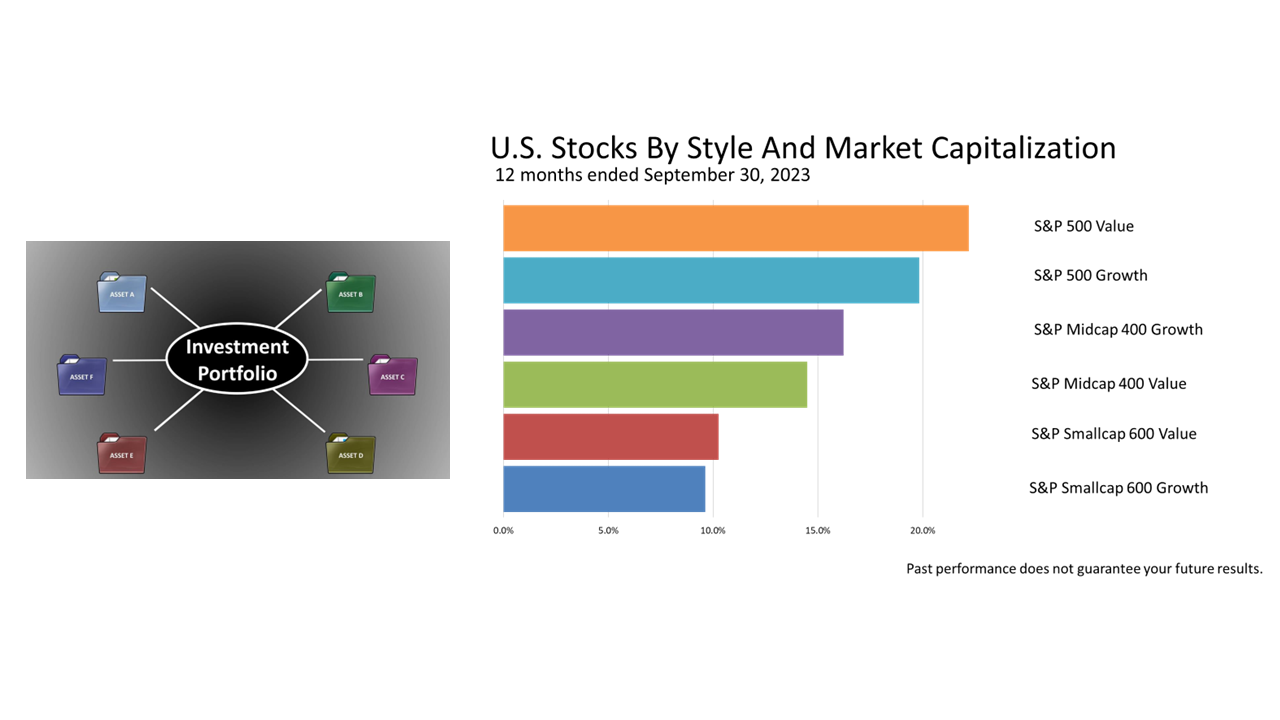
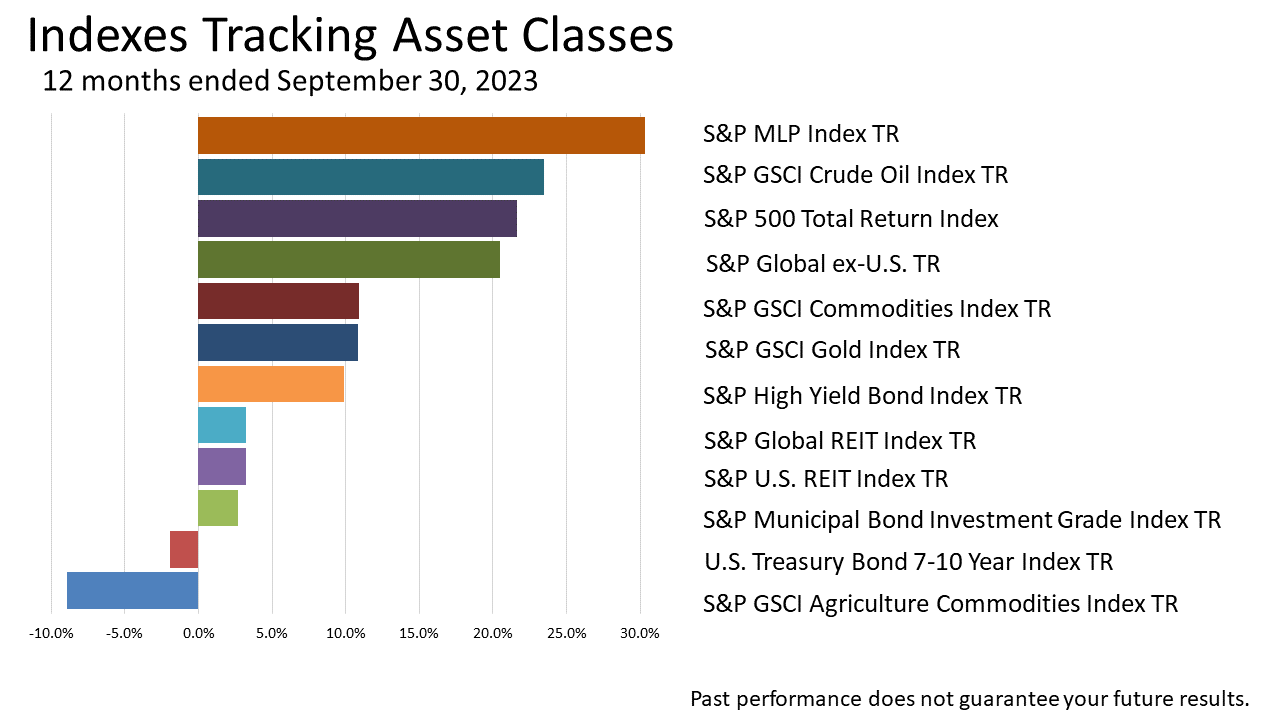
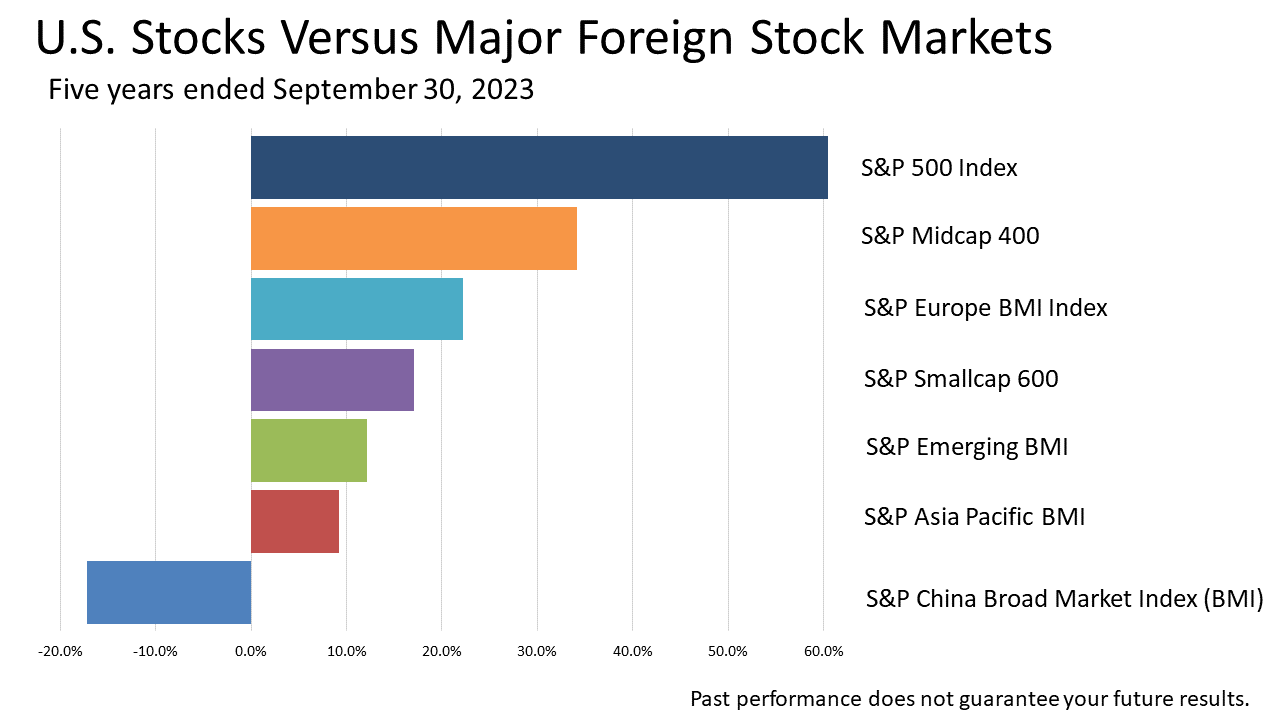
As we mentioned, a portfolio consists of different assets.
On the right, you see the performance of different types of U.S. equities for the 12 months ended September 30, 2023.
Riskier small-company stocks garnered about half the returns of large caps.
Click image to enlarge
Click image to enlarge
Click image to enlarge
Click image to enlarge
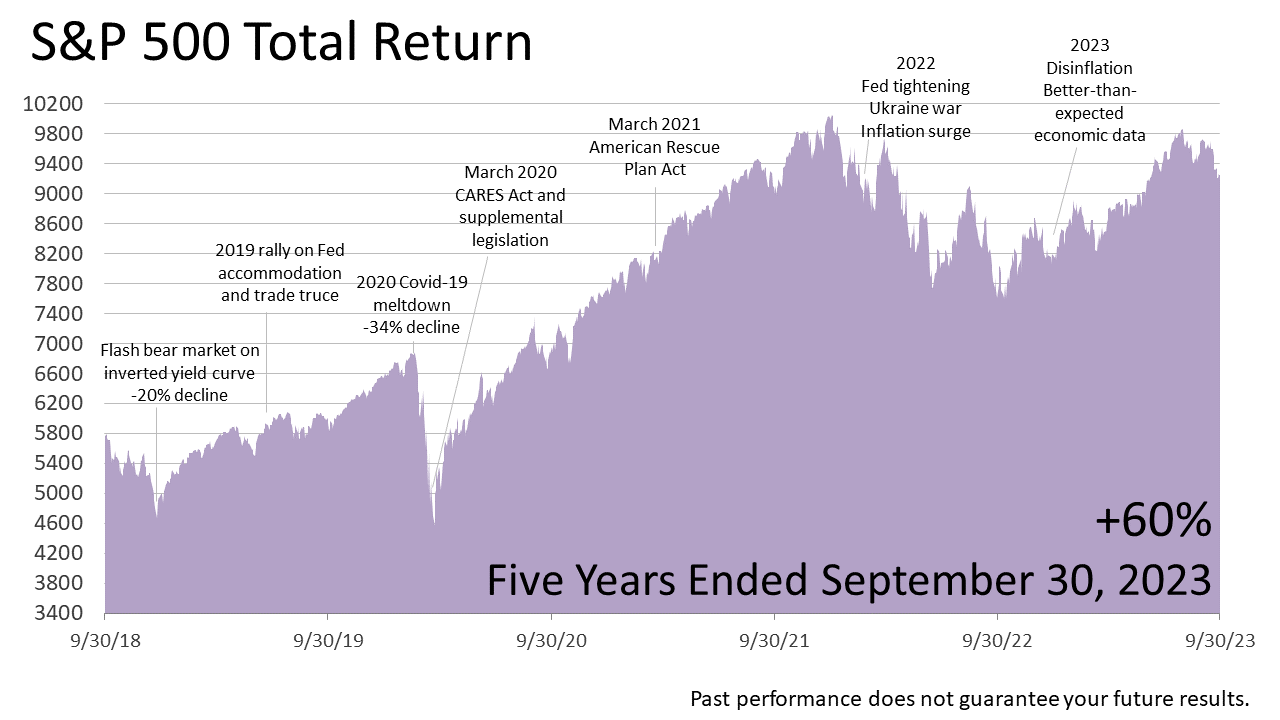
After trading sideways for approximately two years in 2015 and most of 2016 (not without hitting two air pockets during that period), the stock market broke out of that range post- the November 2016 election and rose steadily to an all-time peak on September 20, 2018, whereupon it dove by -20% on investors’ fears that an inverted yield curve was imminent. On January 4, 2019, the Fed signaled rates were on hold, whereupon stocks rallied for most of the remainder of 2019. In February of 2020, stocks hit a new all-time peak, whereupon the Covid-19 virus put the economy and the stock market into meltdown. By early September of 2020, stocks hit a record all-time high following the enactment of the CARES Act and related legislation.
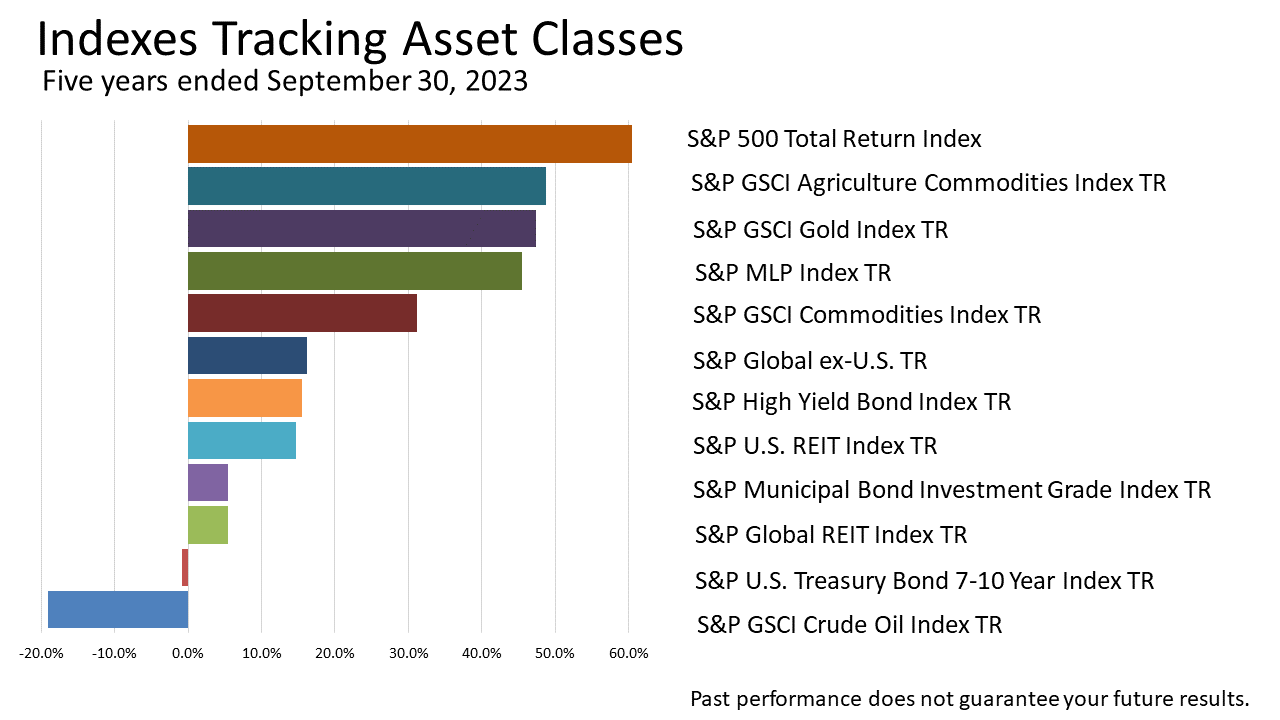
After a pause, stocks rallied steadily from the November 2020 election through year-end. Stocks continued upward through the first quarter of 2021 with the March enactment of the $1.9 trillion American Rescue Plan Act and, despite the Omicron Covid variant, through the end of 2021. Stocks turned down in the first quarter of 2022 on Fed tightening and Russia’s invasion of Ukraine and continued lower through the second and third quarters of 2022 as inflation surged. Stocks rallied modestly in the fourth quarter of 2022 and through the first two quarters of 2023 as inflation cooled and the economy skirted a widely-expected recession. Stocks turned down in the third quarter of 2023 as 10-year Treasury bond yields surged. Over the last five years, including dividends, the S&P 500 Total Return index has gained +60%.
Click image to enlarge
Click image to enlarge
Click image to enlarge
Click image to enlarge

Click image to enlarge
Where The Boom No One Expected Gets Its Legs
The U.S. economy has been much stronger than expected in 2023.
As measured by gross domestic product, the U.S. is growing even though residential housing construction, a key driver of previous U.S. expansions, has been in a slump.
The expansion under way is different from previous expansions.
Things are different because of pandemic-related stimulus payments to consumers and businesses, and passage of legislation funding improvements to roads and bridges, and manufacturing of computers, electronics, and electrical equipment.

Click image to enlarge
A boom in construction of facilities for manufacturing computers, electronics, and electrical equipment helps explain the surprising strength of U.S. economic growth.
The expansion of 2023 was not expected. In December 2022, the consensus forecast of top Wall Street strategists interviewed in Barron’s predicted the Standard & Poor’s 500 index would close 2023 at 4000. Except for the last three weeks of March, the stock index has been higher than 4000 all year long.
One of the reasons economic growth has stayed stronger than expected is the boom in U.S. construction of manufacturing facilities under way.
It’s a quiet boom that gets little press but makes total sense. The Infrastructure Investment and Jobs Act, Inflation Reduction Act, and CHIPS Act each provided direct funding and tax incentives for manufacturing construction.

Click image to enlarge
Since the beginning of 2022, after-inflation spending on construction of facilities for manufacturing computers, electronics, and electrical equipment nearly quadrupled in the U.S., according to a June 2023 Treasury Department report.
Compared with November 2021, real nonresidential construction spending increased by about 15%.
The computer-electronic segment is the dominant component of the U.S. manufacturing construction boom.
Importantly, however, the boom in this segment of the construction industry has not come at the cost of reduced spending on other segments of manufacturing construction.
In fact, construction spending for chemical, transportation, and food/beverage manufacturing plants is also up from 2022, albeit much less than the spending on building new computer-electronics manufacturing facilities, according to U.S. Treasury data.
Click image to enlarge
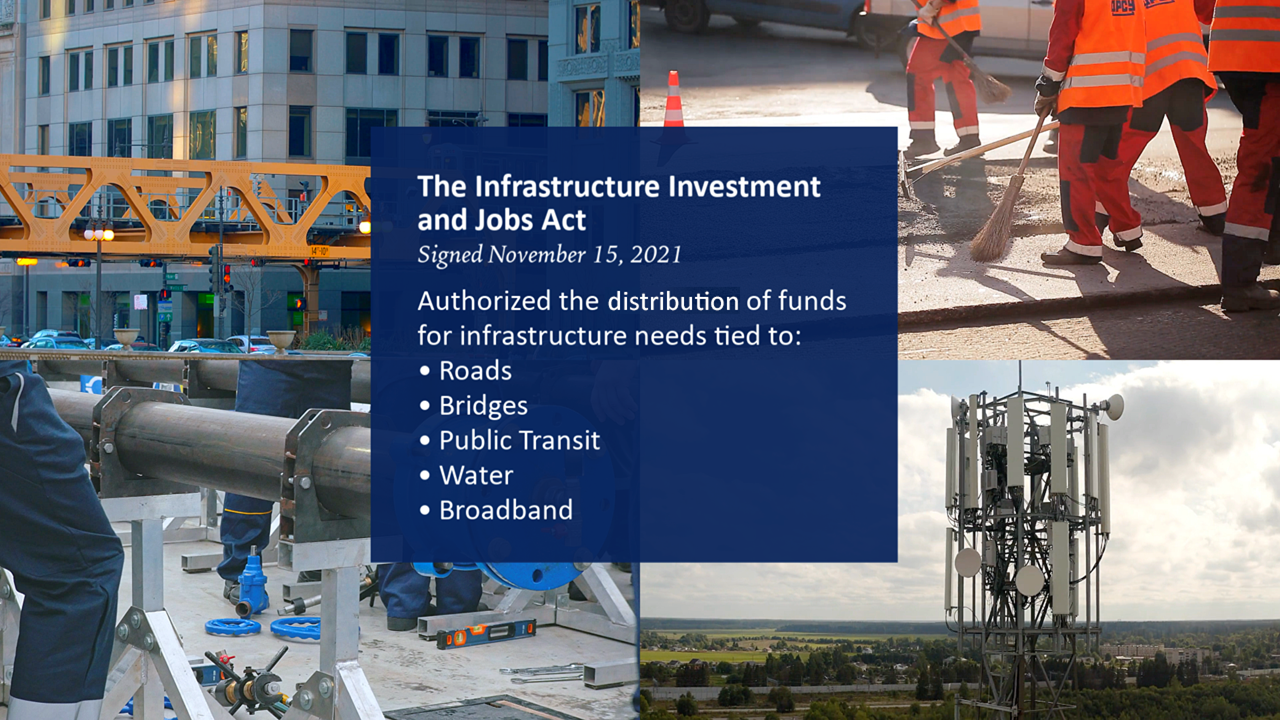
The Infrastructure Investment and Jobs Act authorized the federal government to distribute new funds to state and local governments for infrastructure needs tied to roads, bridges, public transit, water, and broadband.
That funding has begun translating into spending, the Treasury Department says, explaining the surprising growth in nonresidential construction. It is worth noting that other advanced economies have not experienced similar increases in manufacturing construction, according to roughly analogous data sets examined by U.S. Treasury analysts.
The U.S. economy is very different than it was in previous decades.
The effects of the pandemic still reverberate, and massive federal programs to promote or make direct investments in infrastructure and high-tech manufacturing are part of the reason why the boom no one expected has legs.

